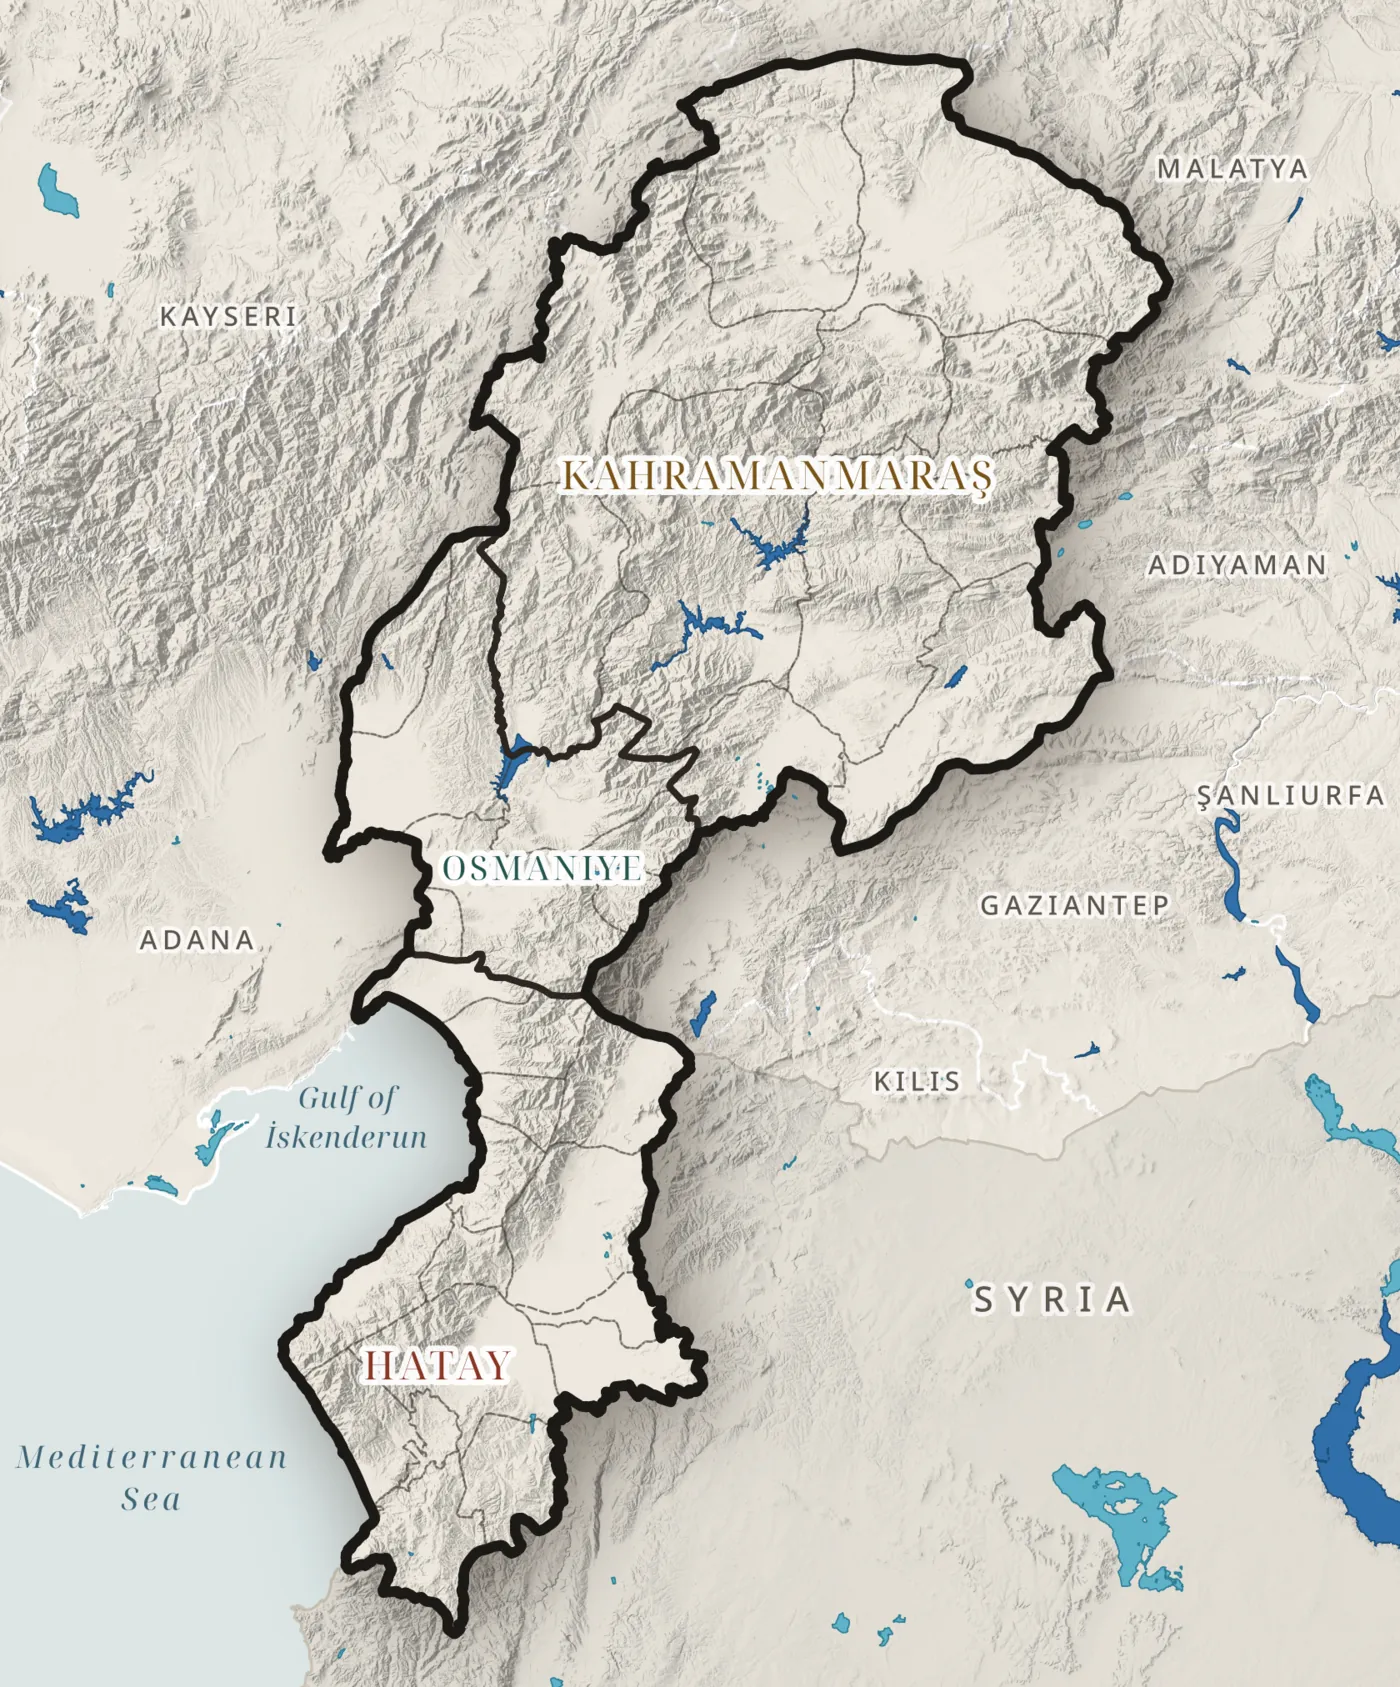
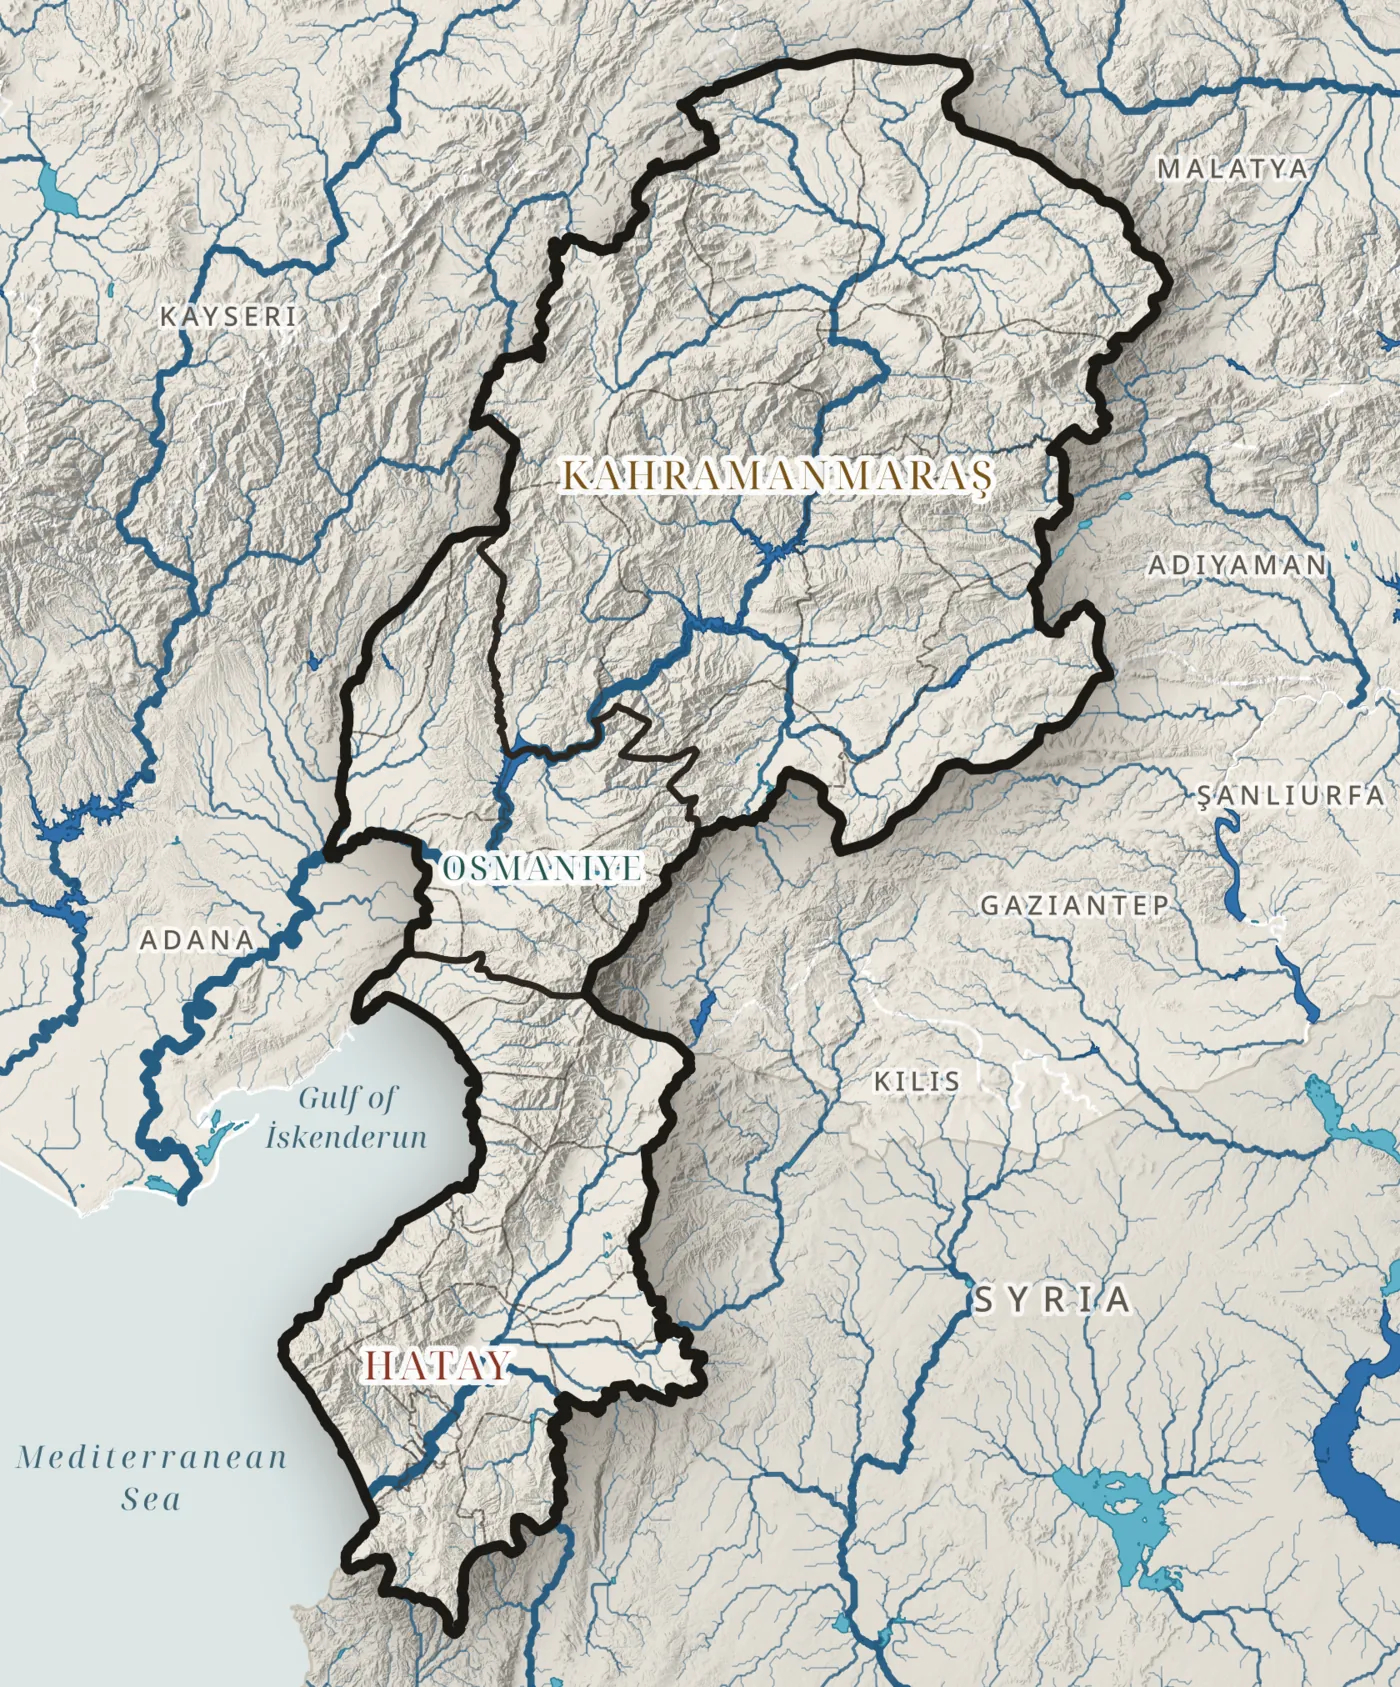
River network
Rivers drain from the mountains to two seas
0km
m of river per km² · up to m³/s on the lower Ceyhan
HydroRIVERS (HydroSHEDS) · stream order (Strahler) · Map H01
Stream order
Half of the network is headwater streams
% of the length
Order 1: streams with no tributaries
↑ ↓ change the order
HydroRIVERS · Strahler order: 1 = smallest headwater, 6 = main river
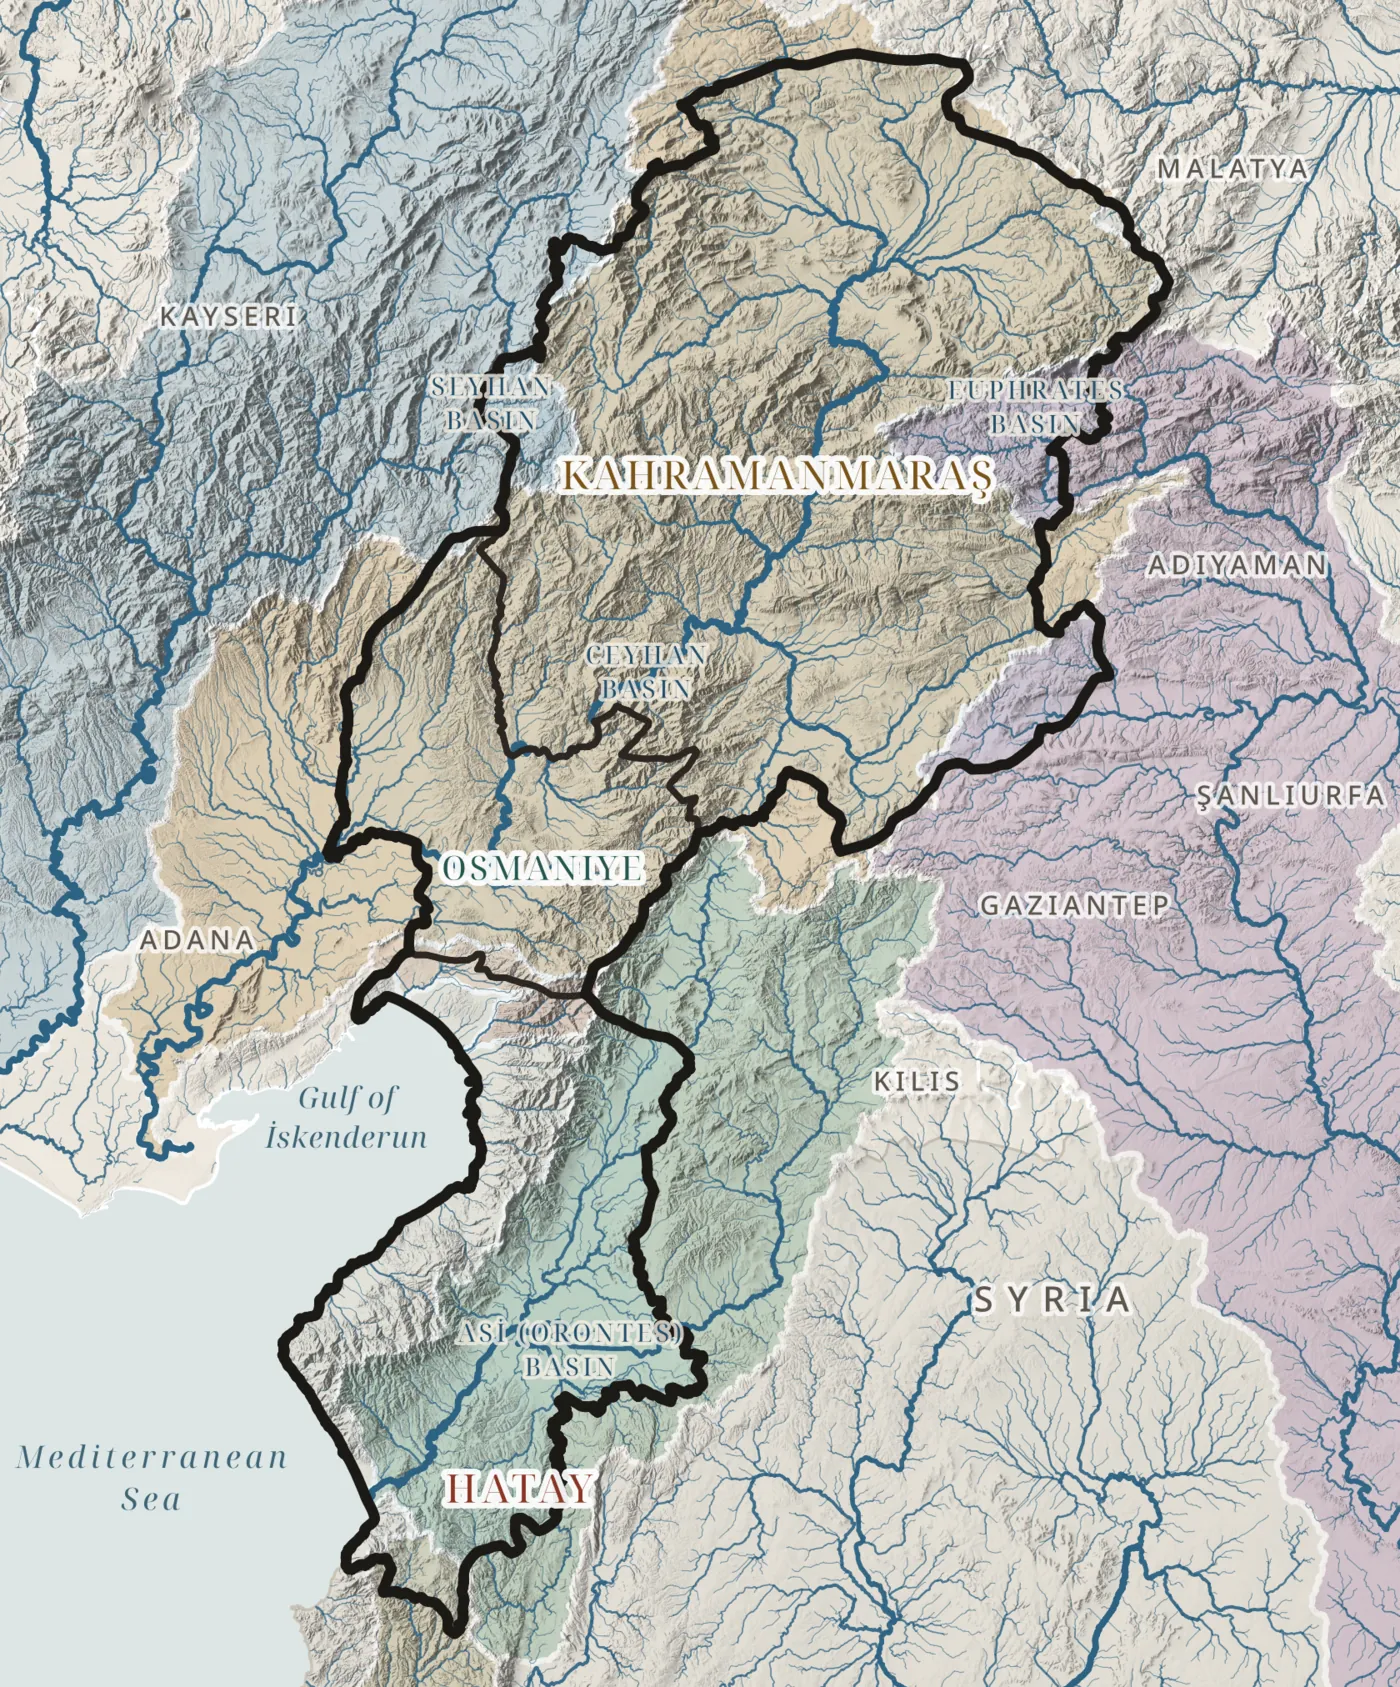
Drainage basins
The terrain sets the watersheds
Copernicus DEM GLO-30 · drainage basins from the elevation model
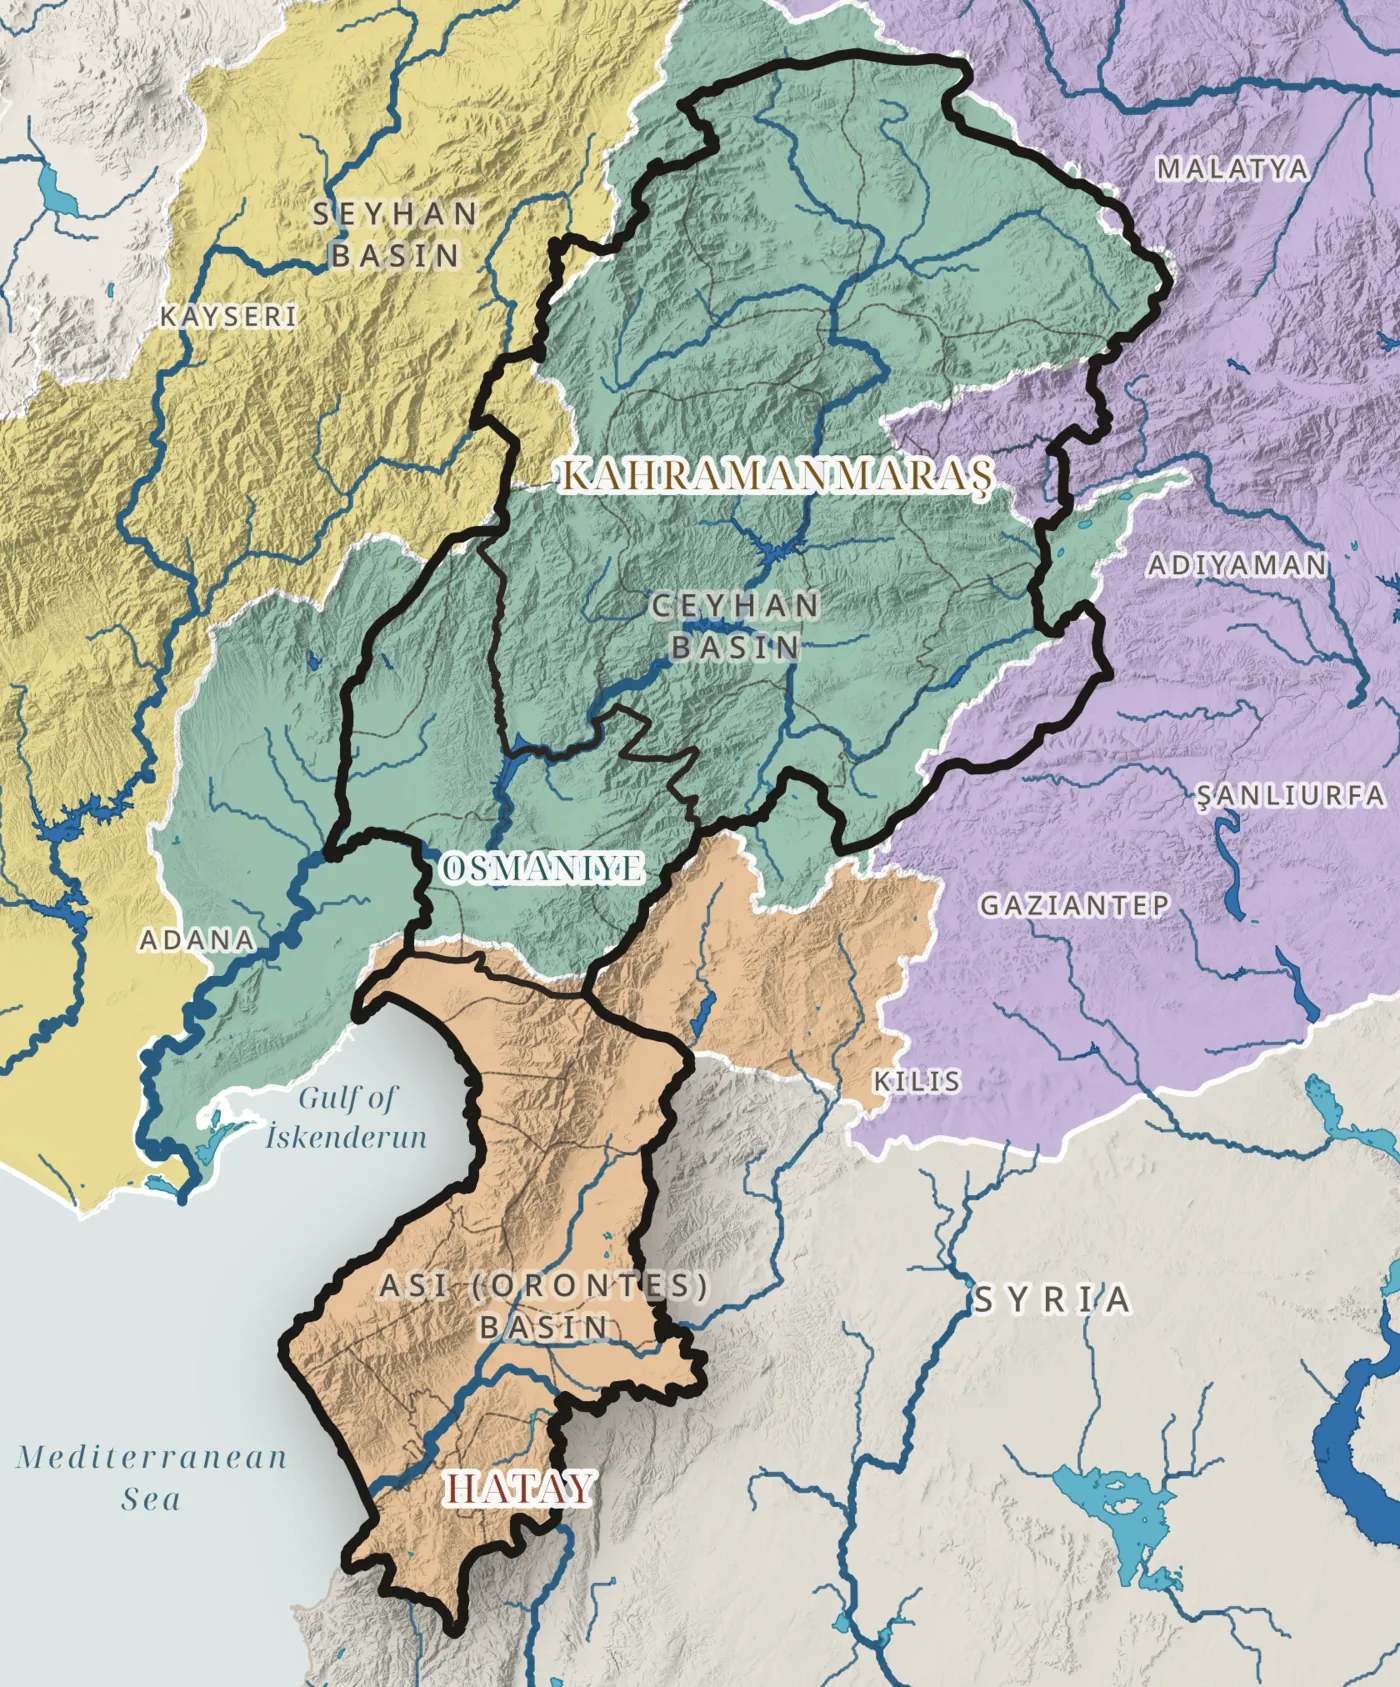
River basins
The Ceyhan drains two thirds of the region
% drains to the Asi
a transboundary river that reaches Hatay from Syria and the sea at Samandağ
Official river basins of Türkiye (DSİ) · HydroRIVERS · Map H02 · arrows show flow direction
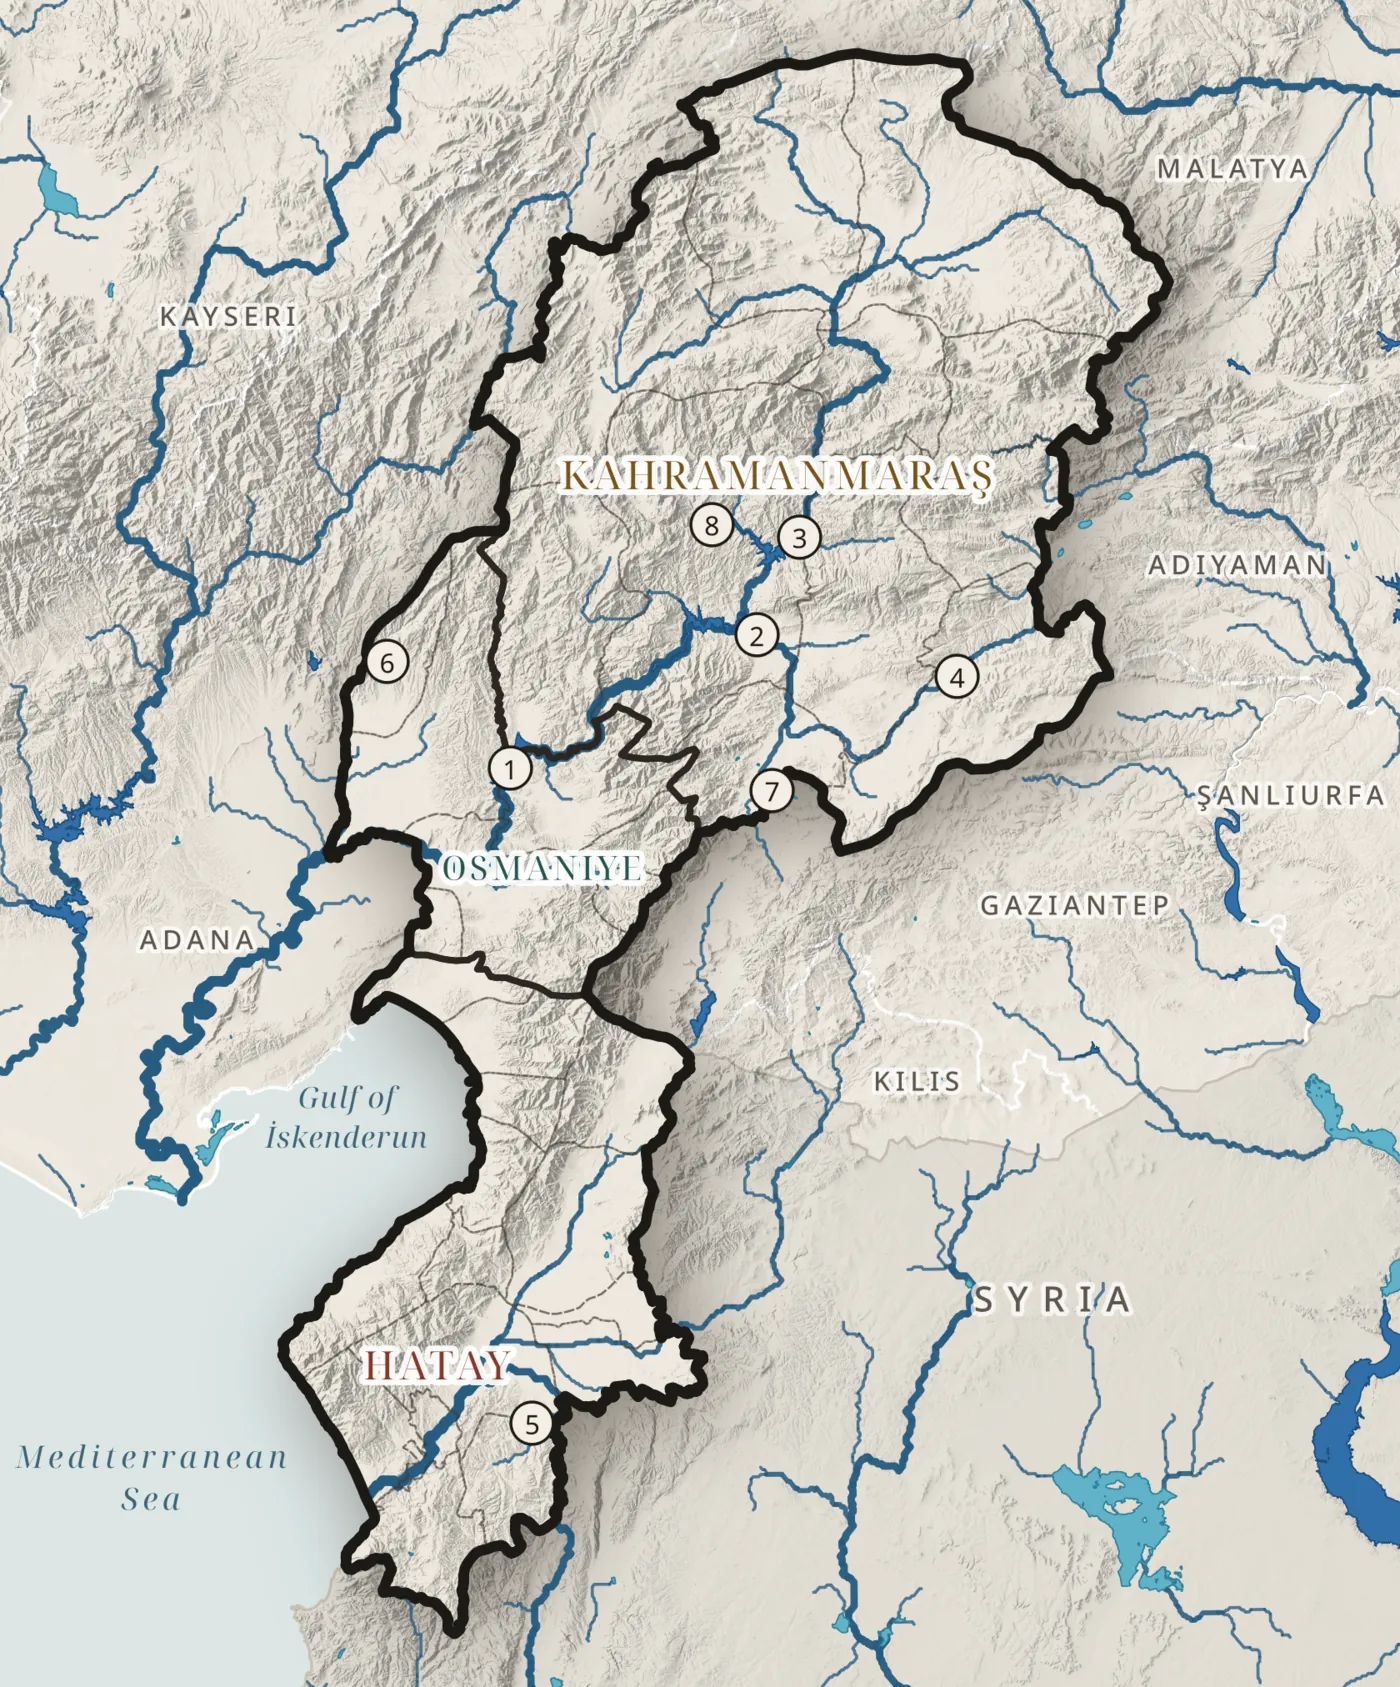
Lakes and reservoirs
Almost all stored water sits behind dams
0water bodies
0km² of water
0km³ stored
HydroLAKES (HydroSHEDS) · water bodies larger than about 10 ha · Map H03
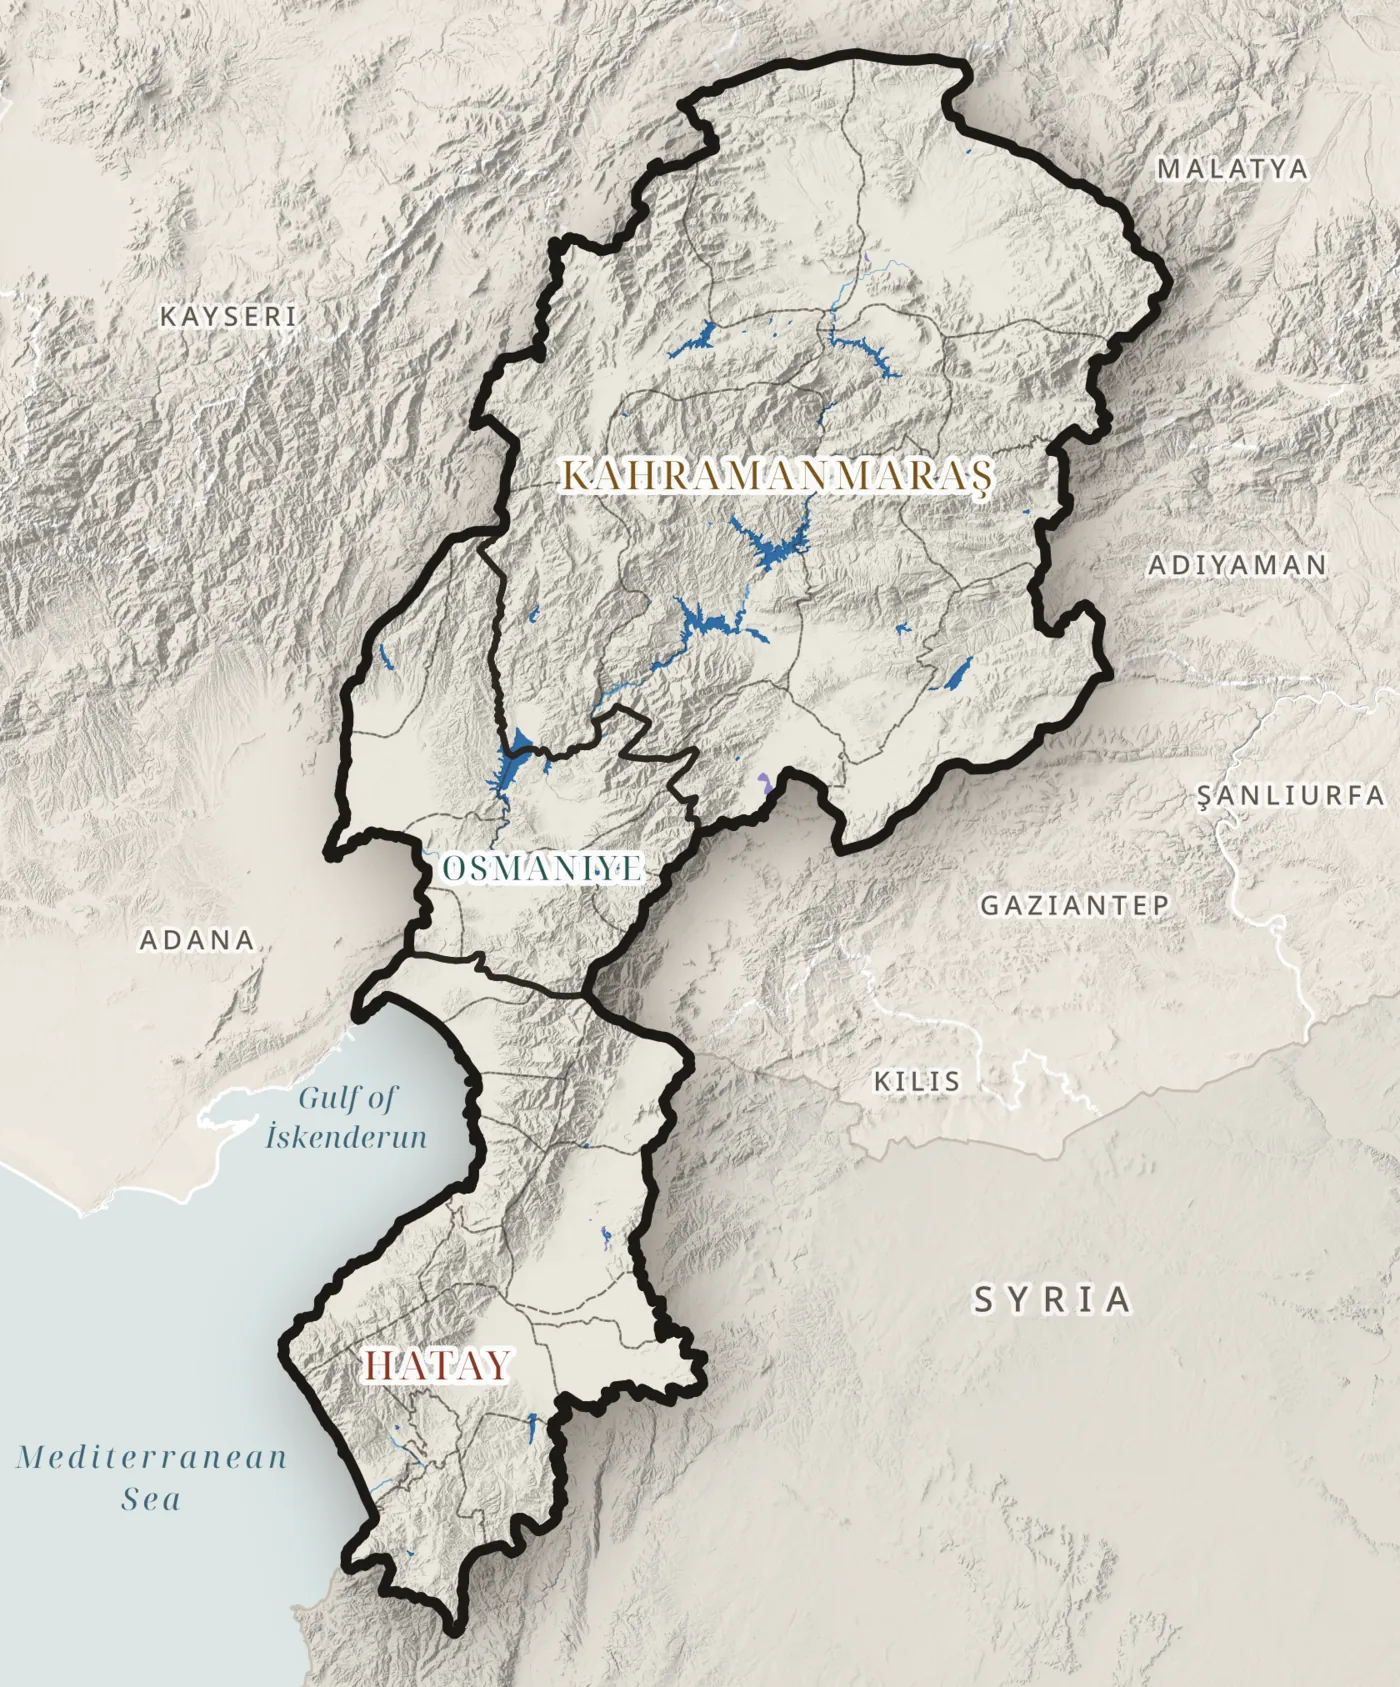
Land cover
Open water and wetland are rare
0km²
water bodies, water courses and marshes · about 1% of the region
CORINE Land Cover 2018 · Map L10
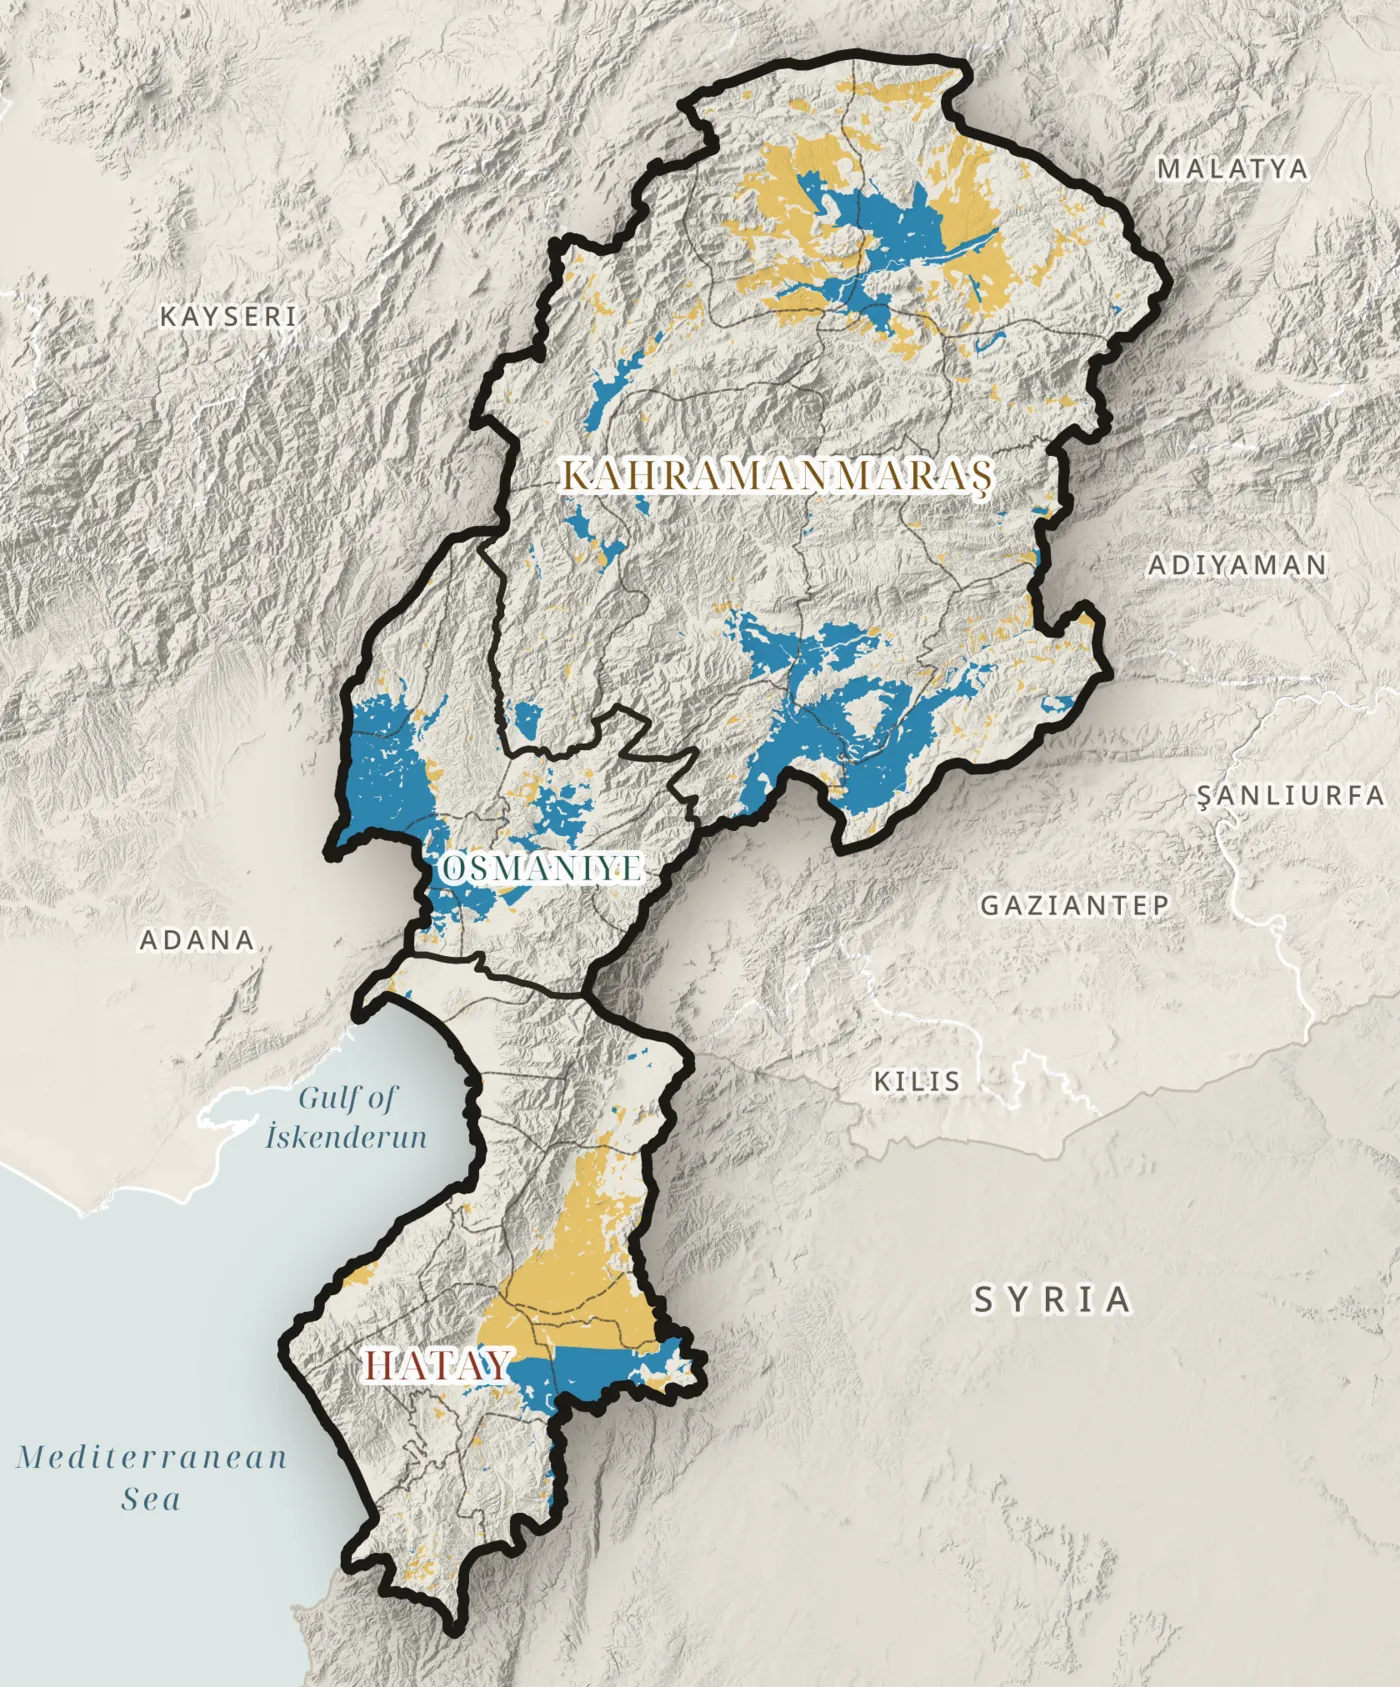
Irrigation
The plains below the dams are irrigated
0km² irrigated
CORINE Land Cover 2018 · class 212, permanently irrigated land · Map L06
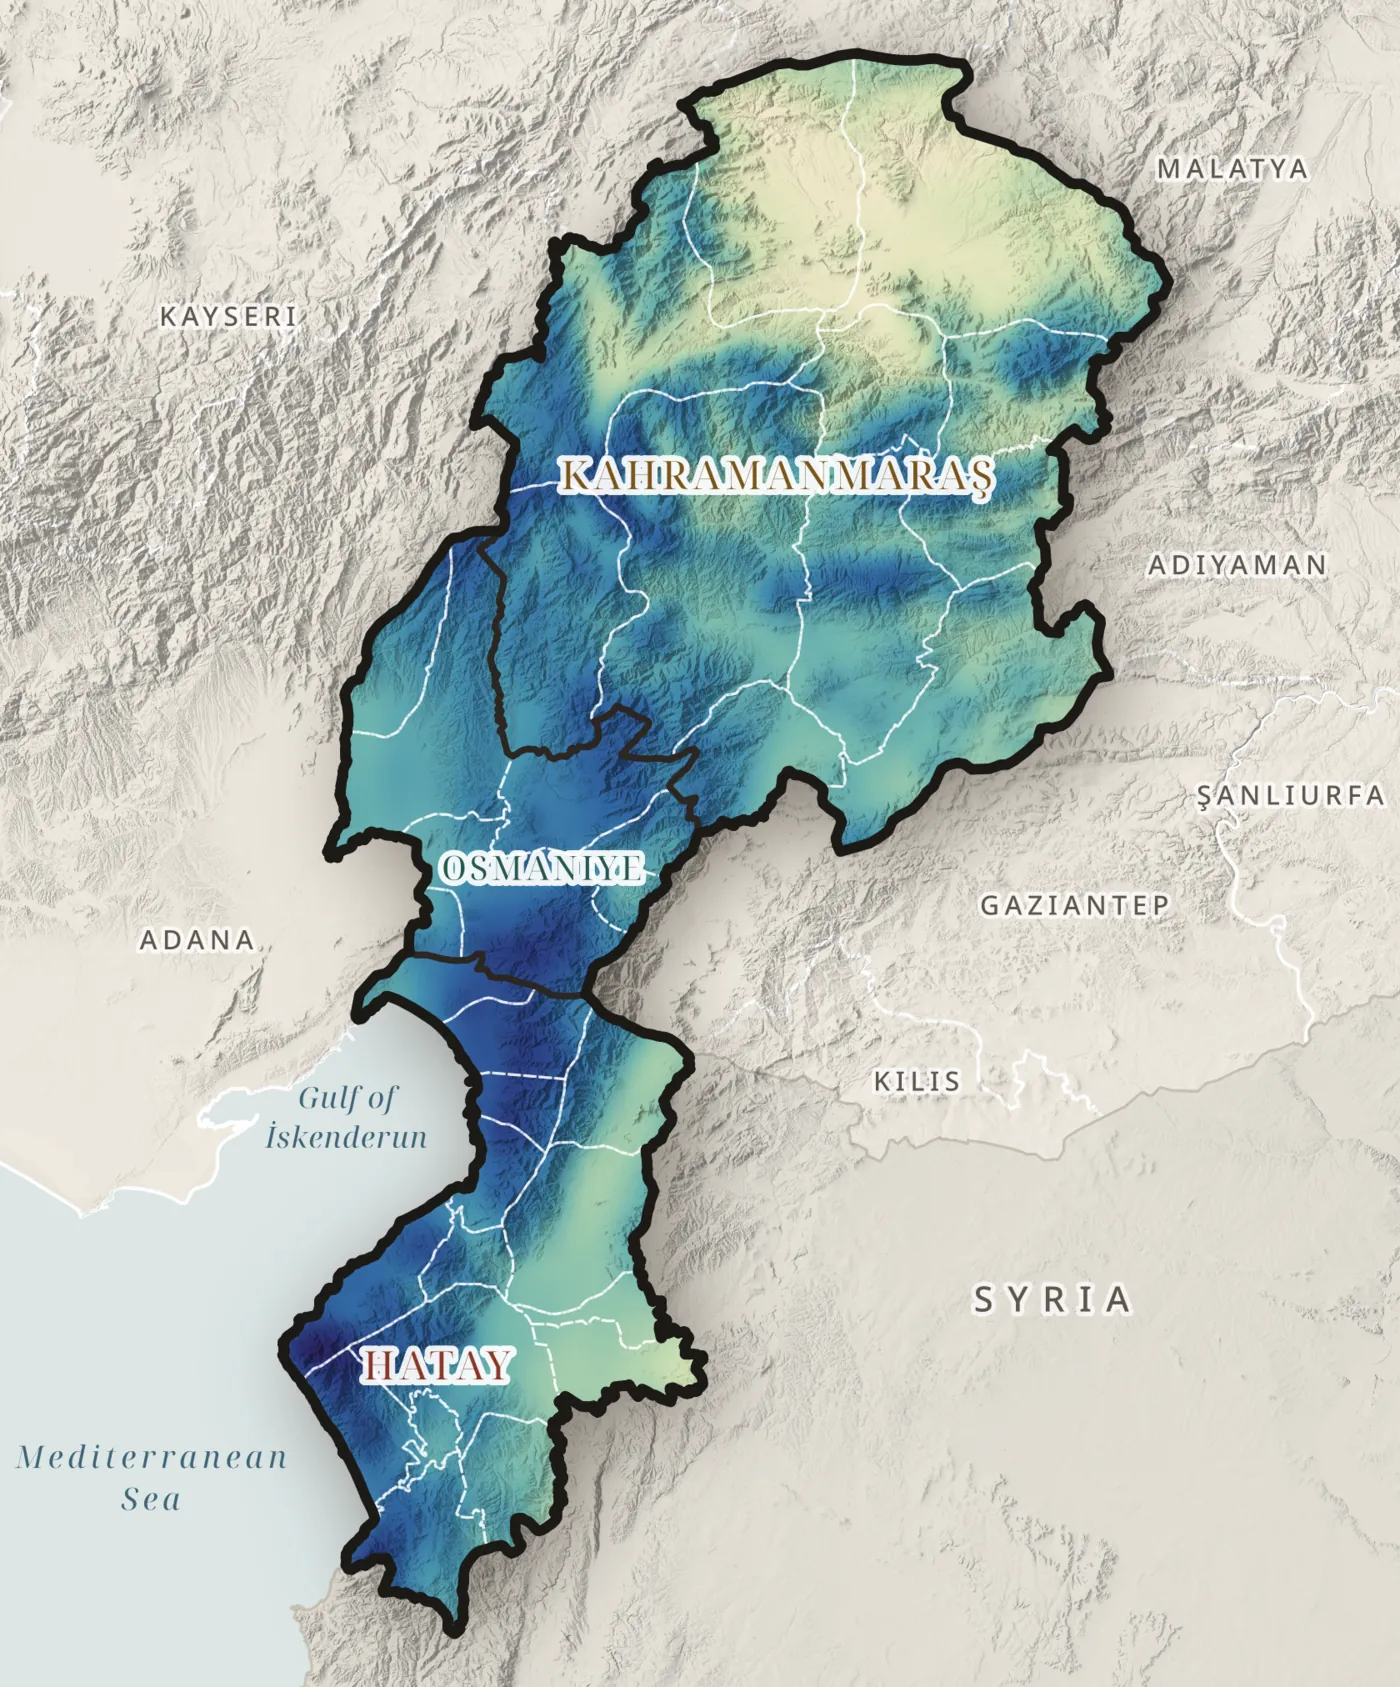
Annual precipitation
Six times more rain on the coast than on the plateau
CHELSA V2.1, 1981–2010 · Map T01
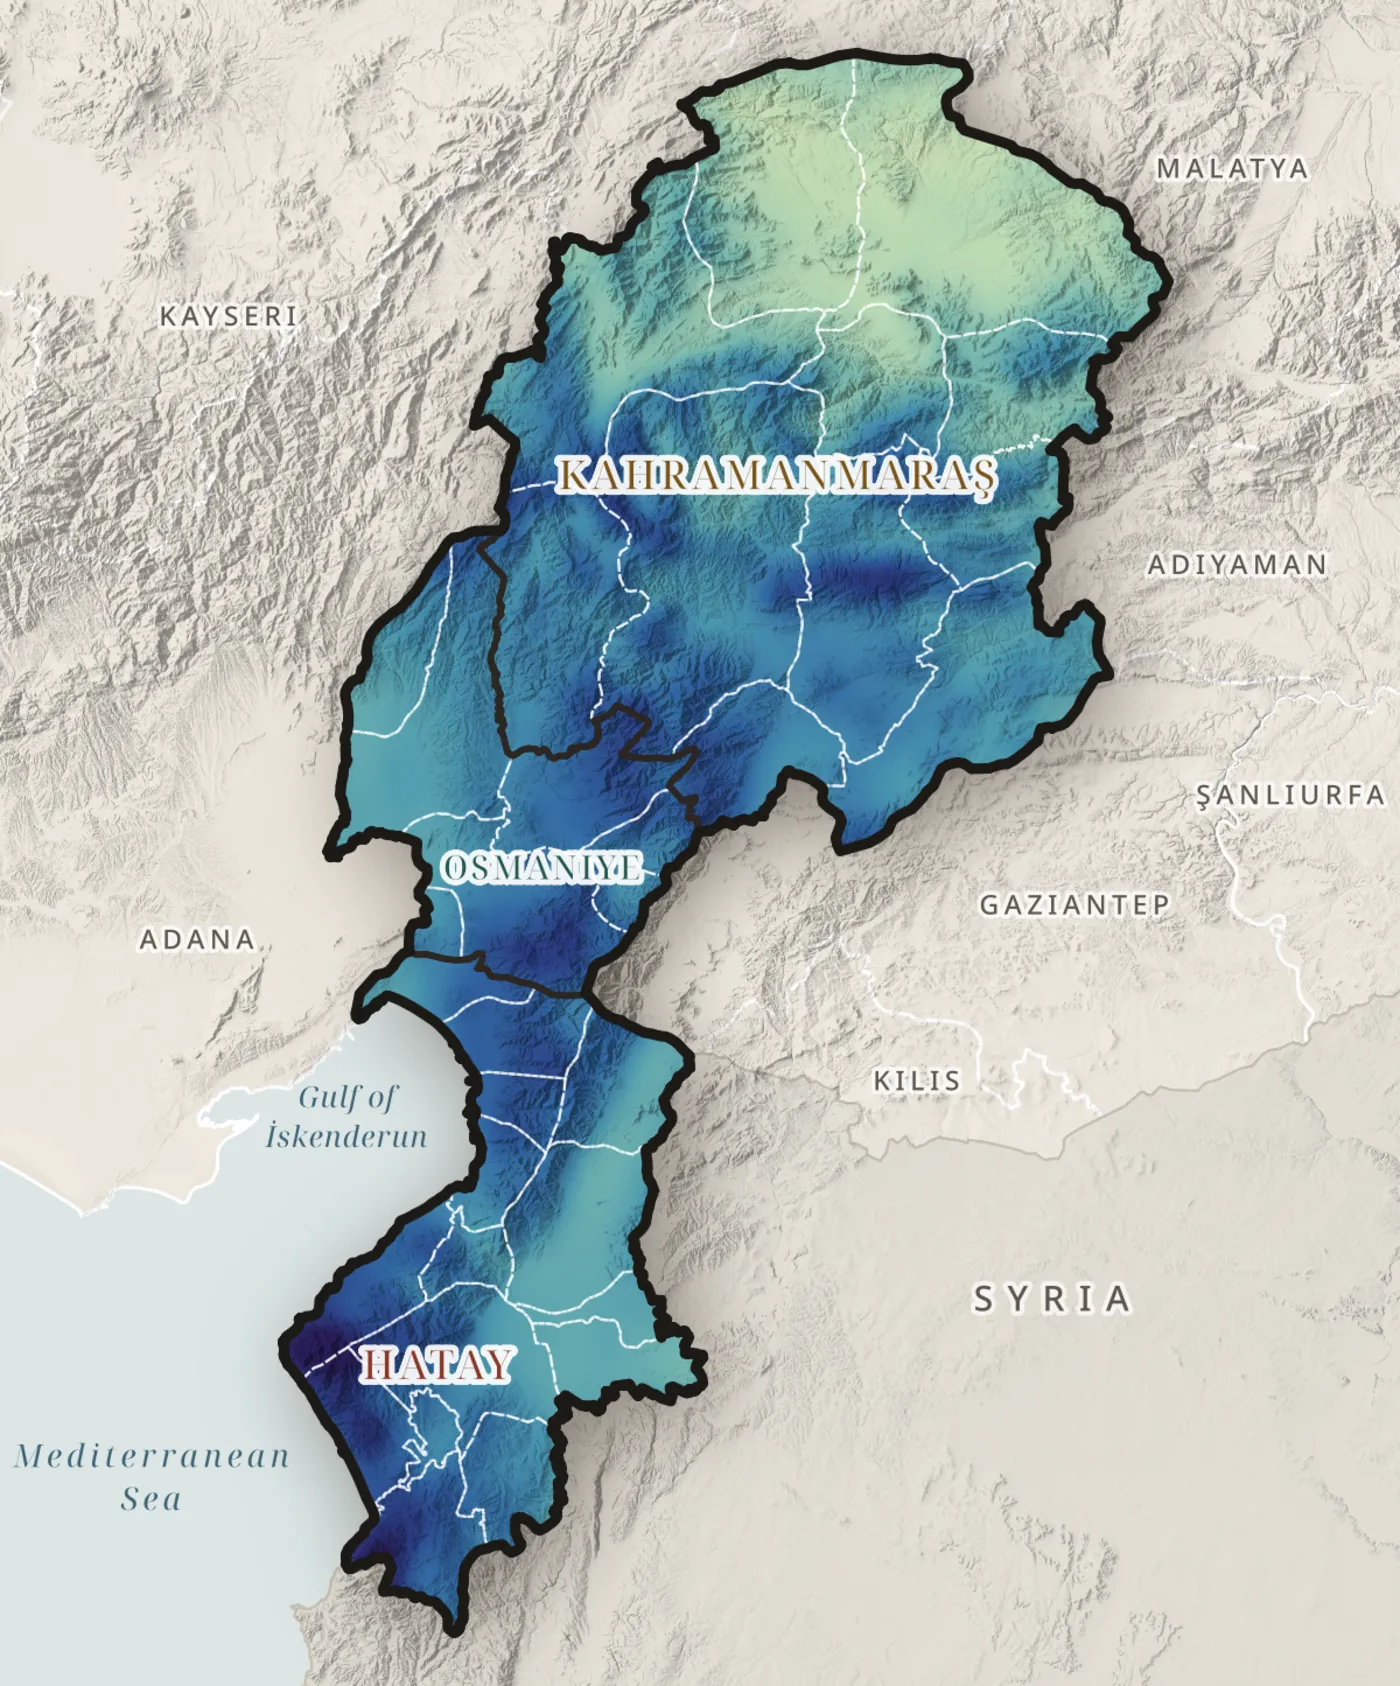
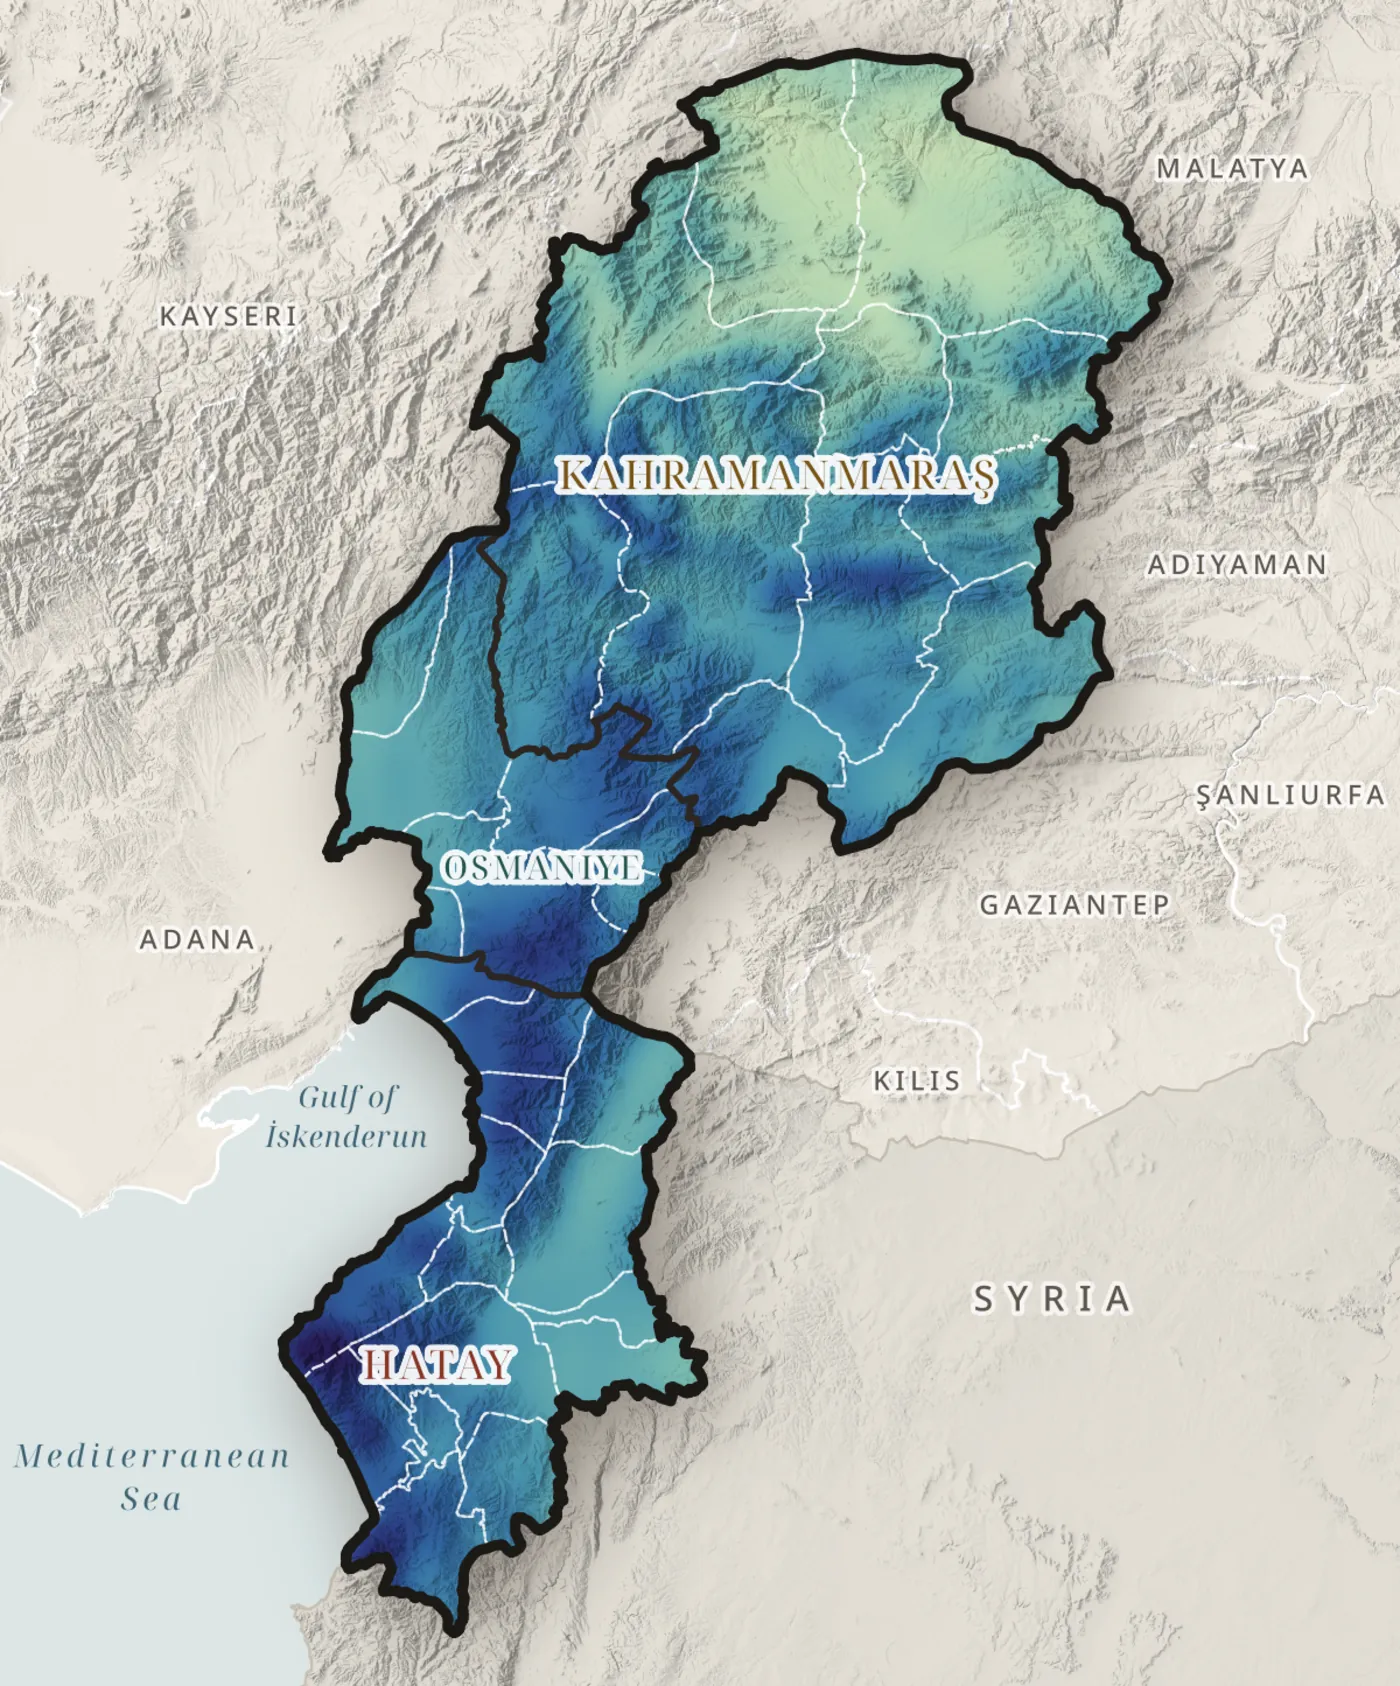
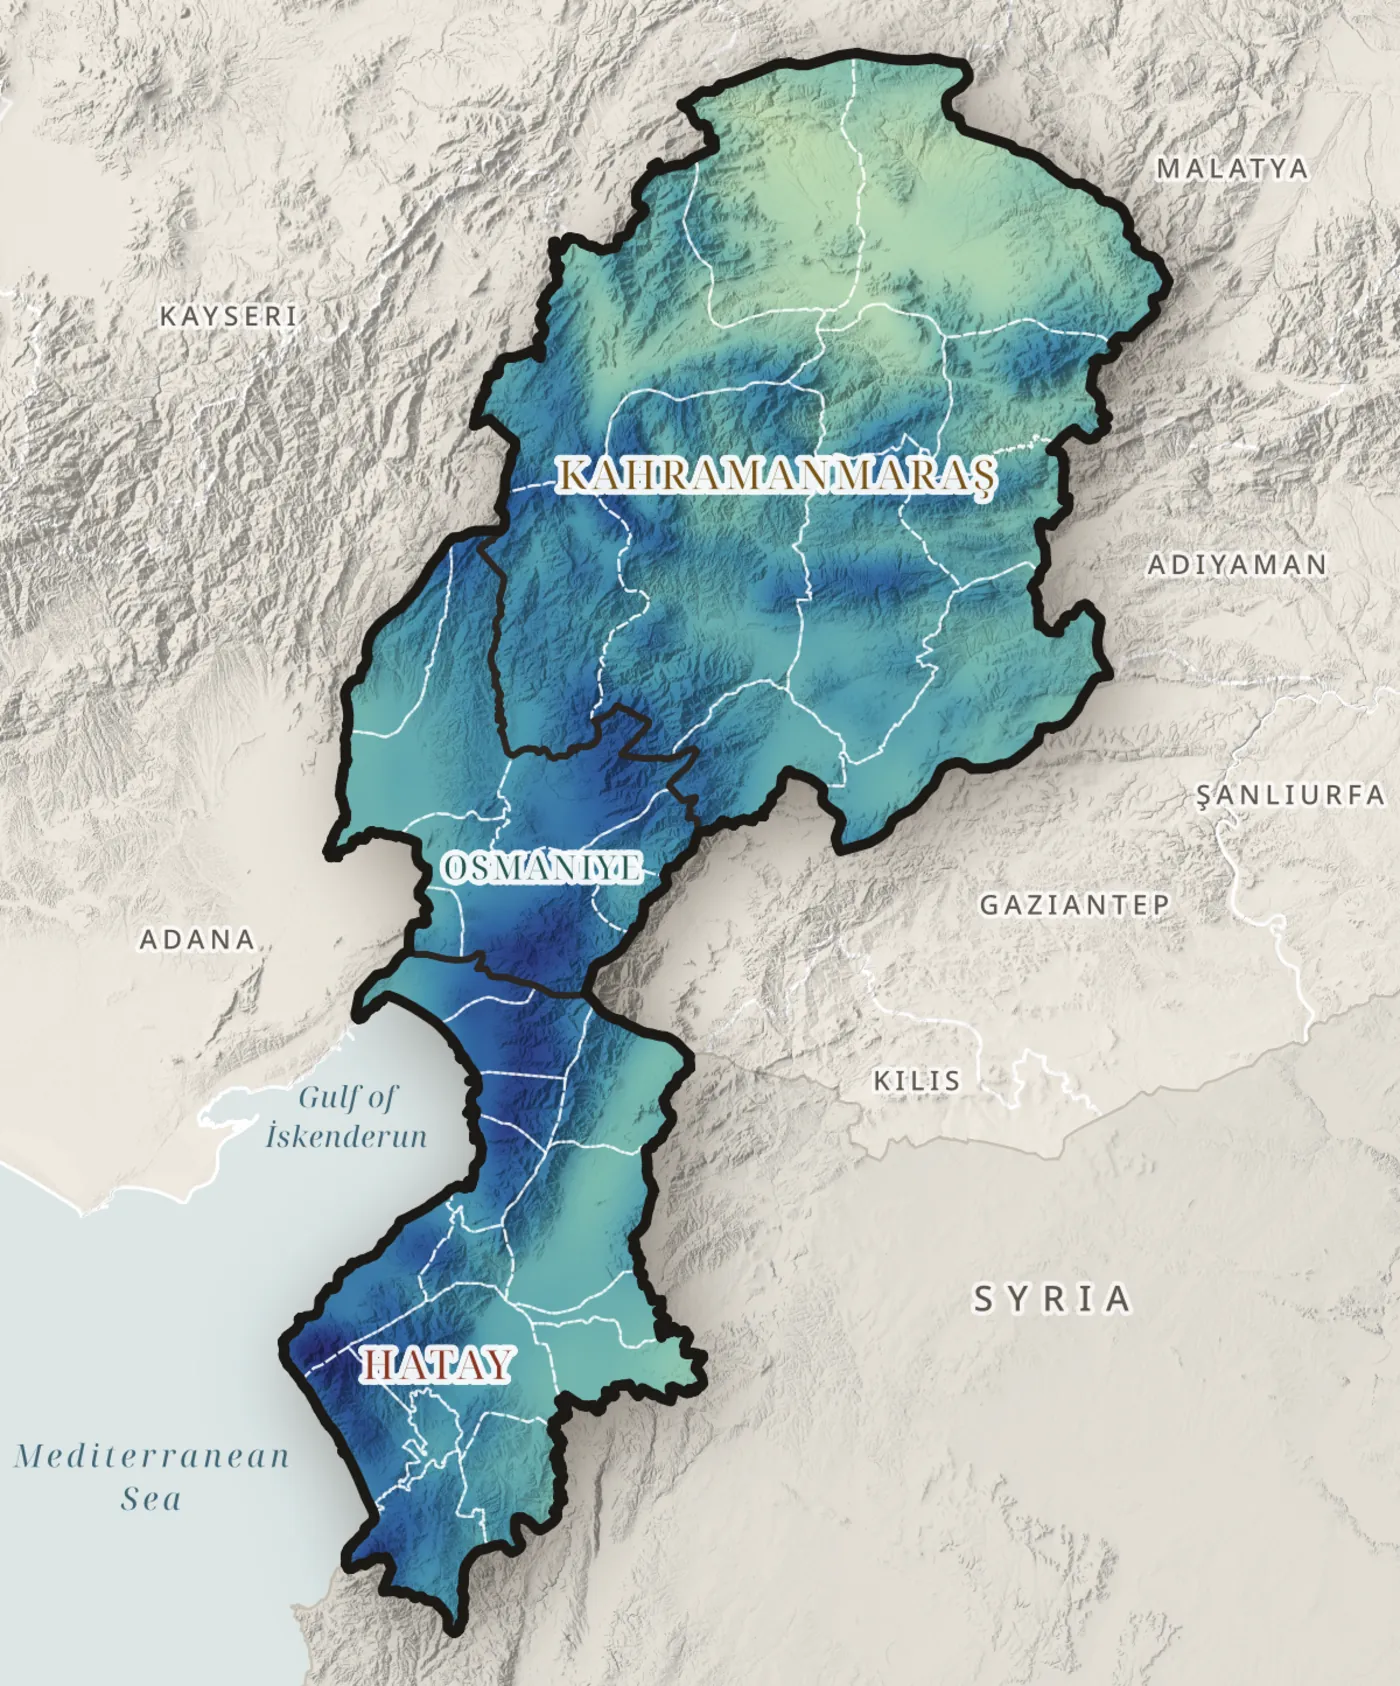
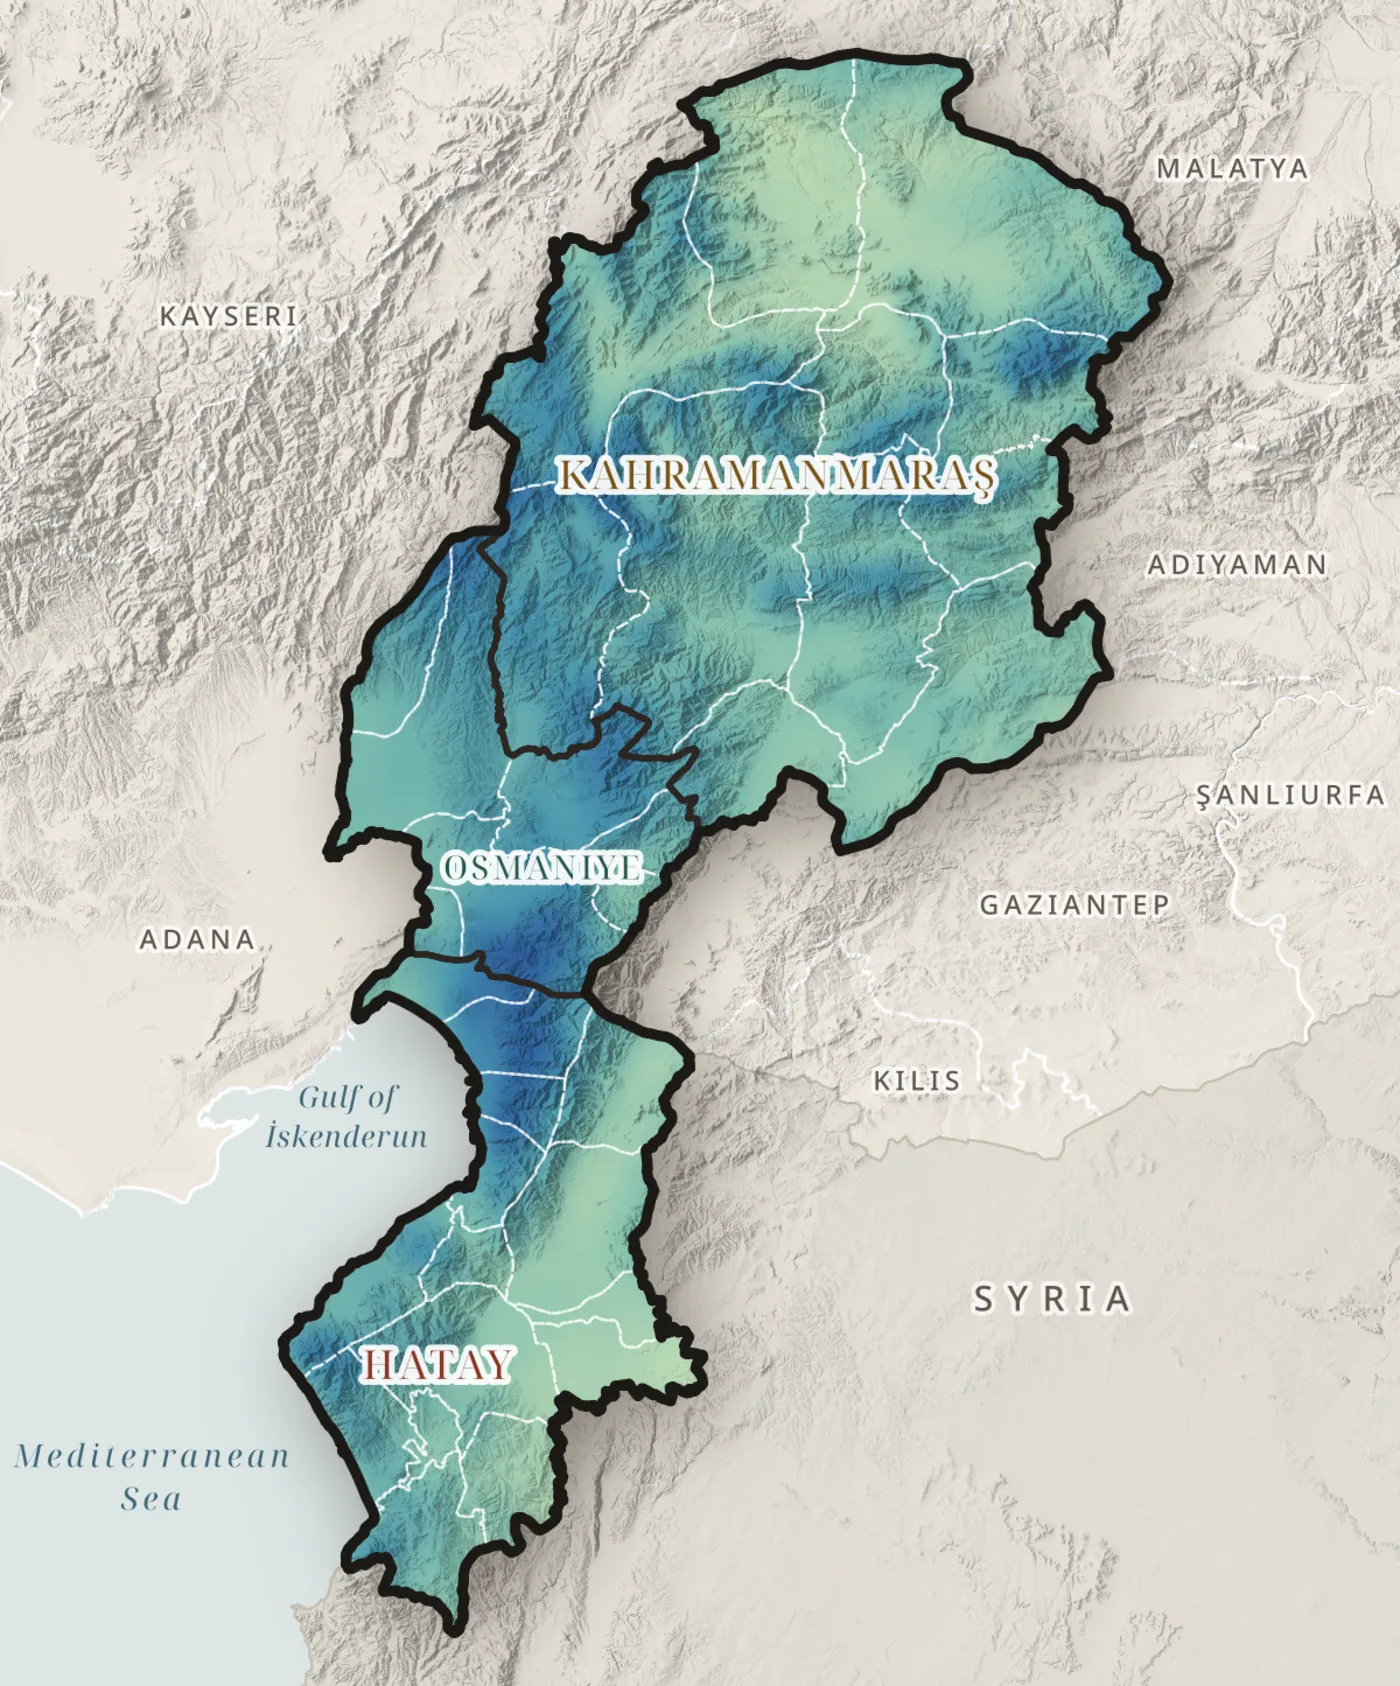
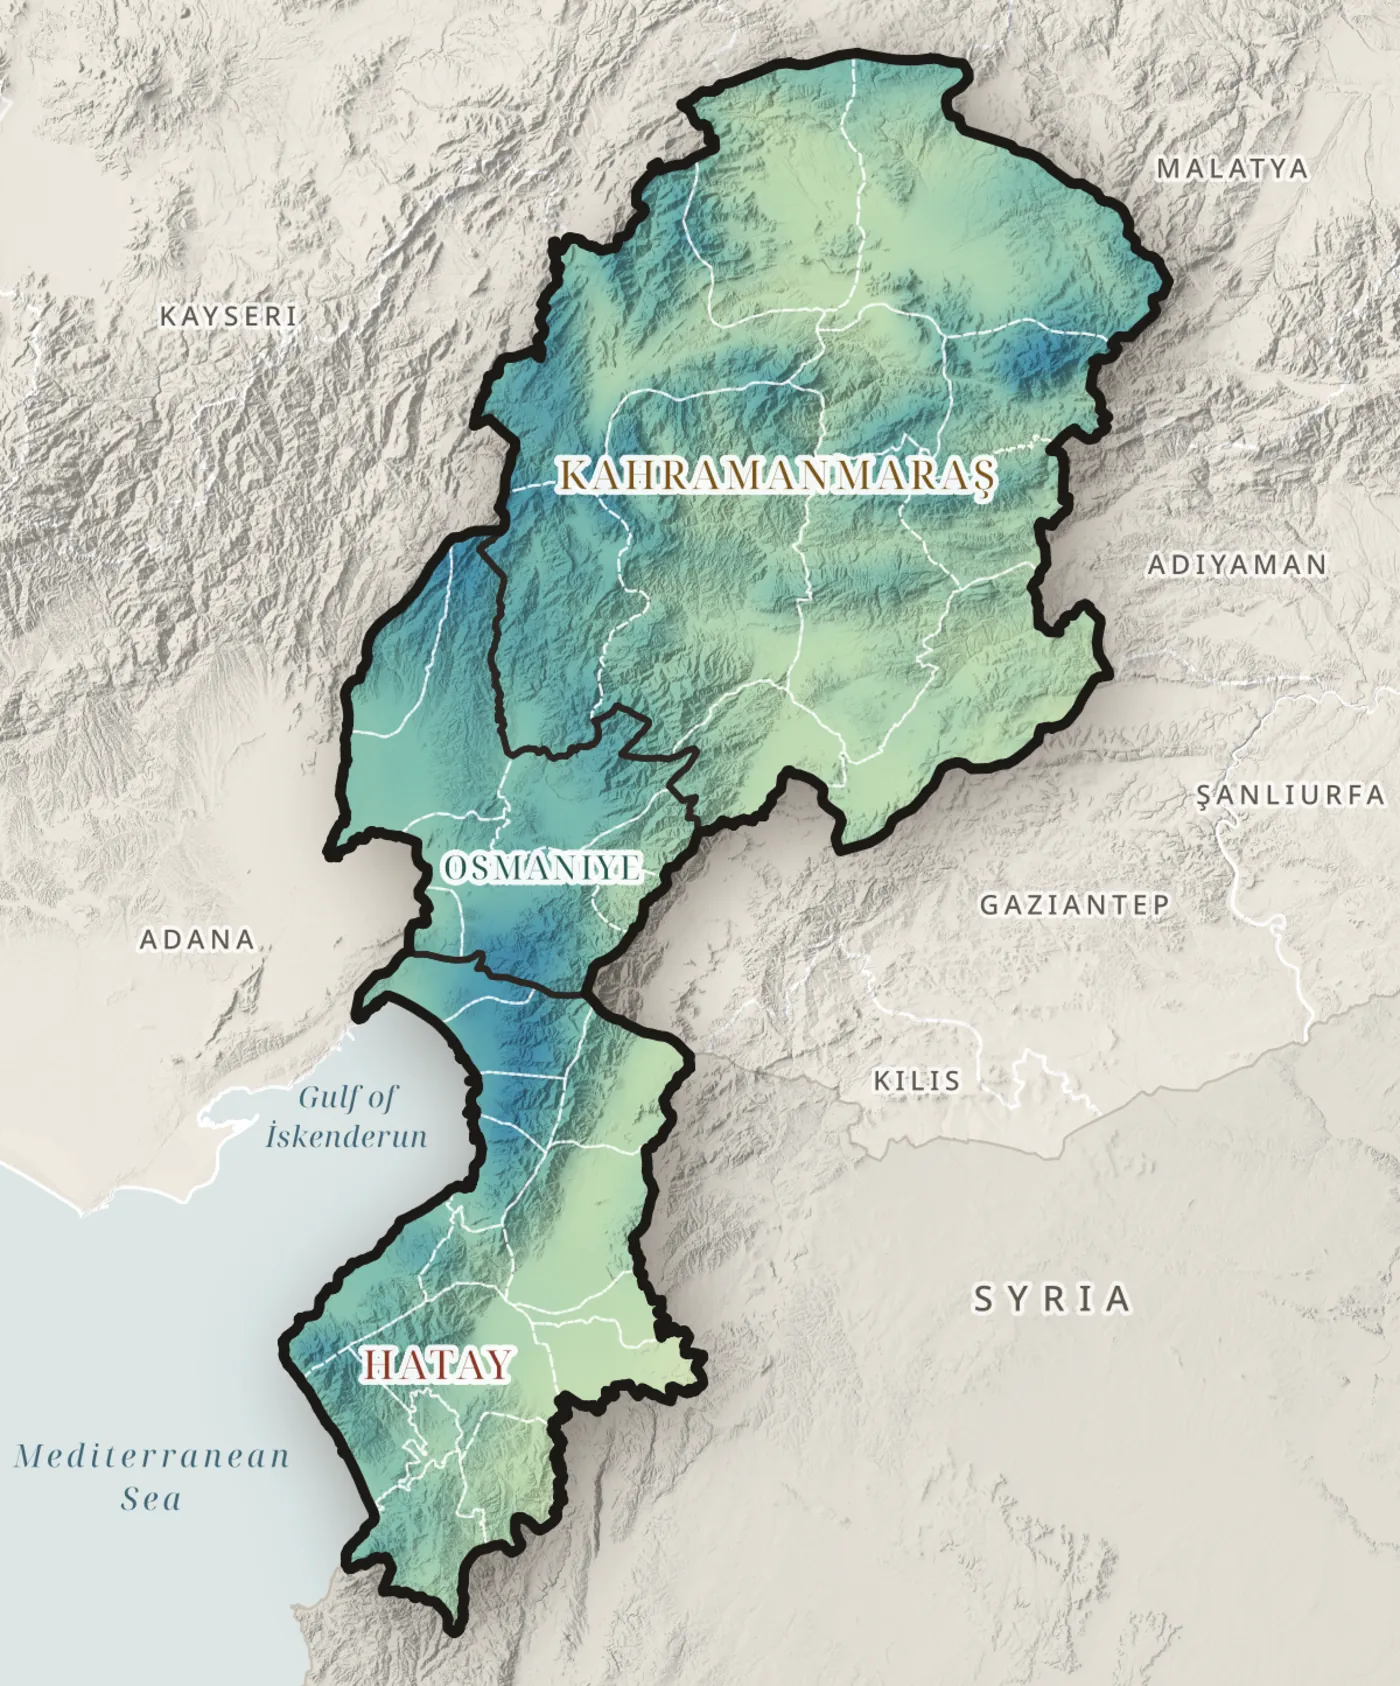
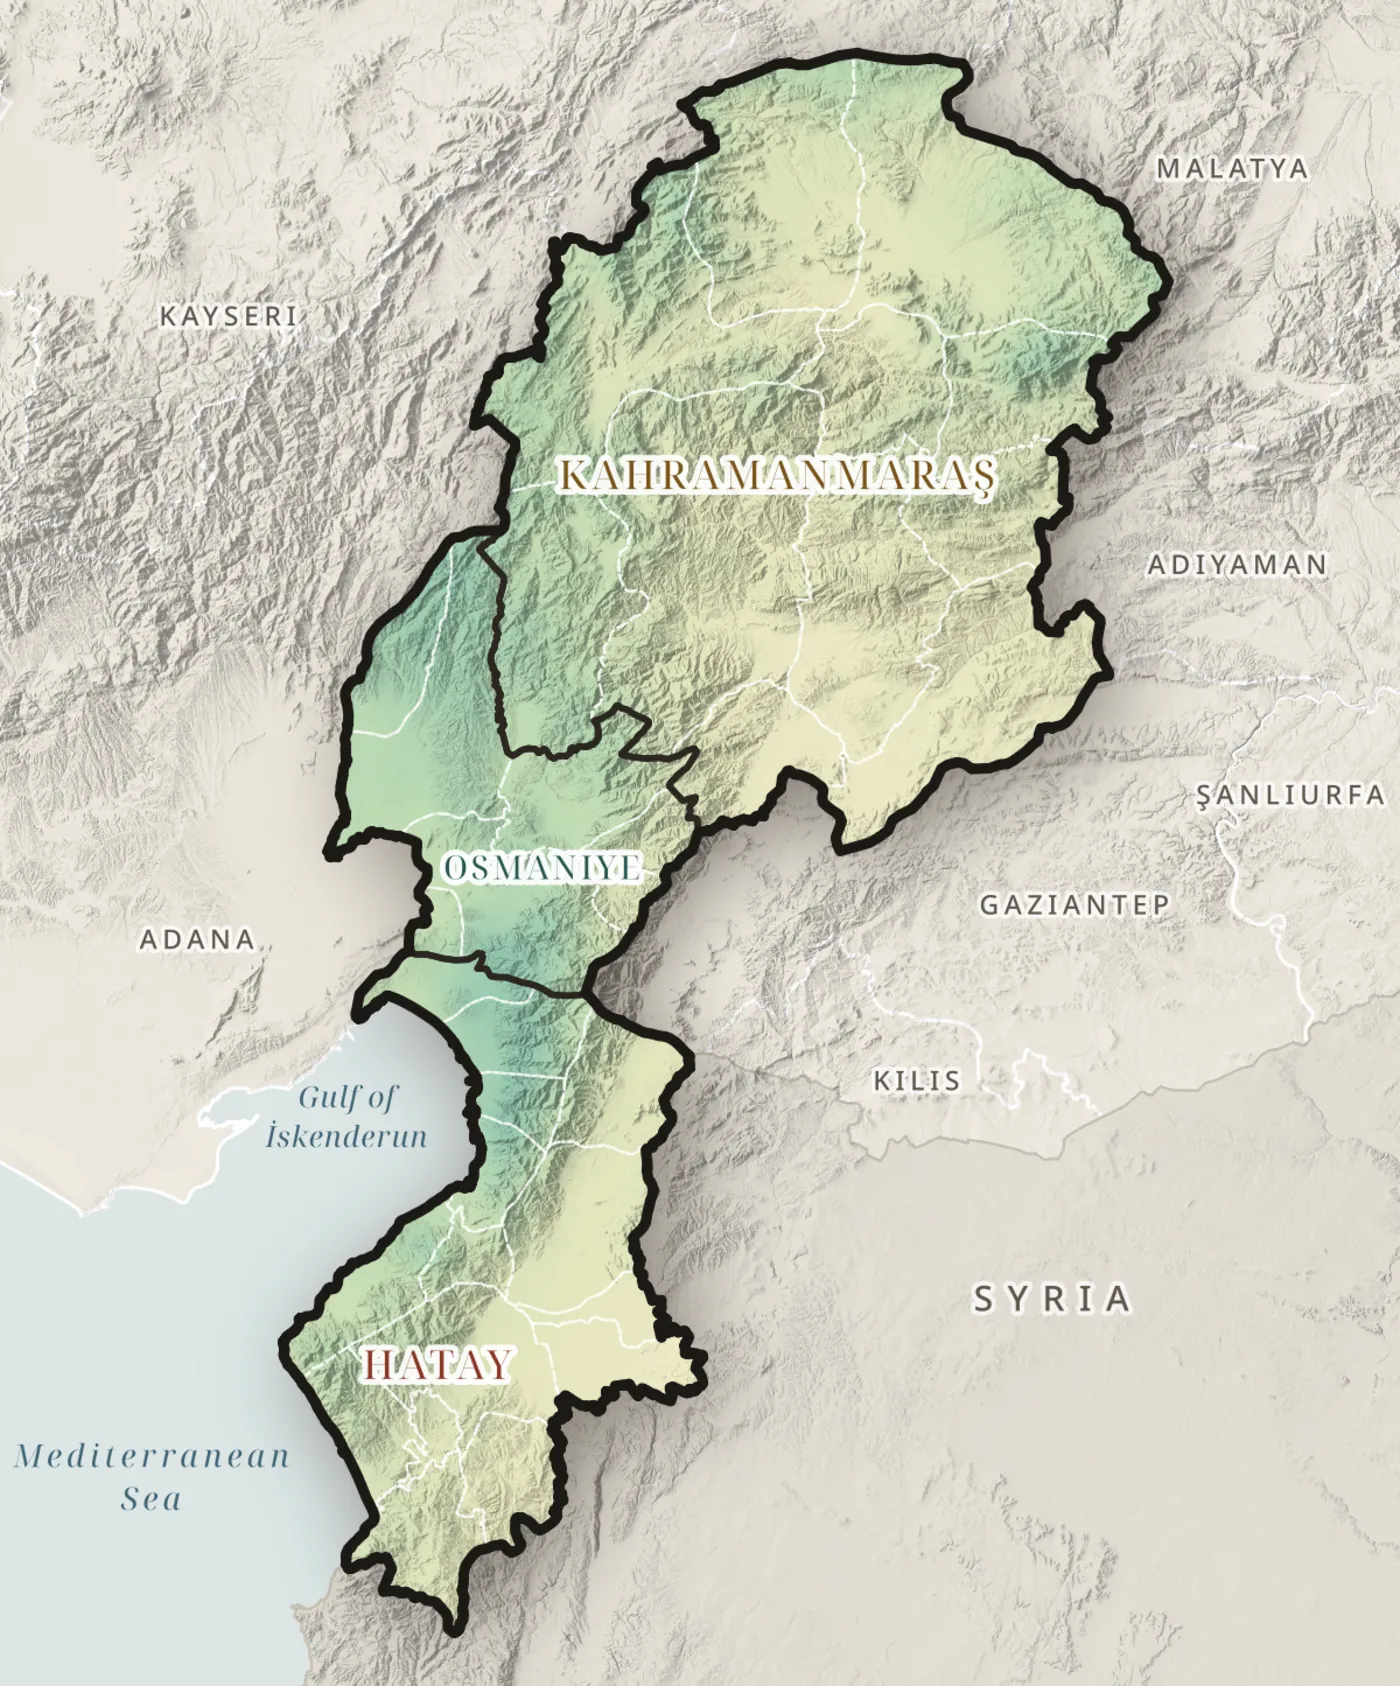
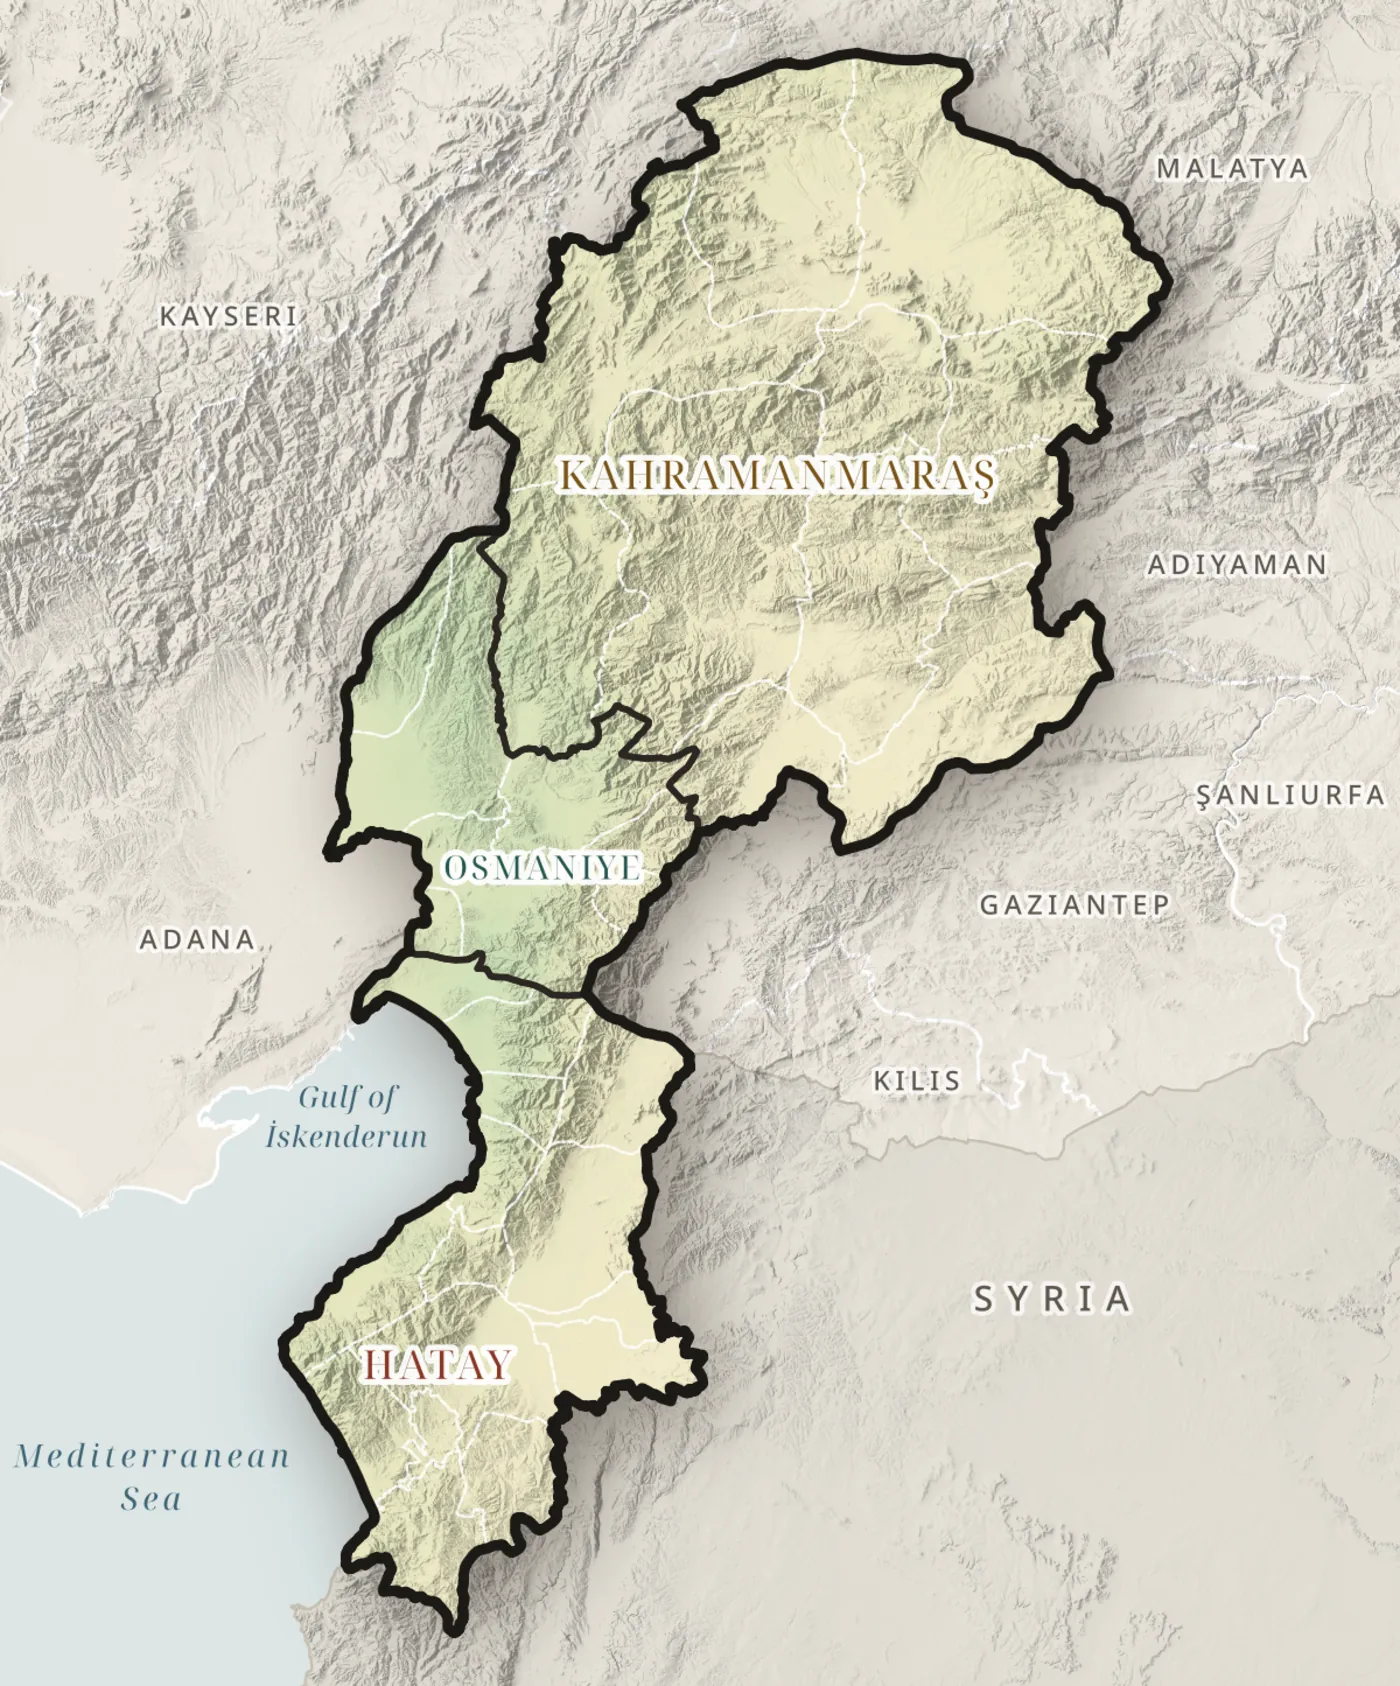
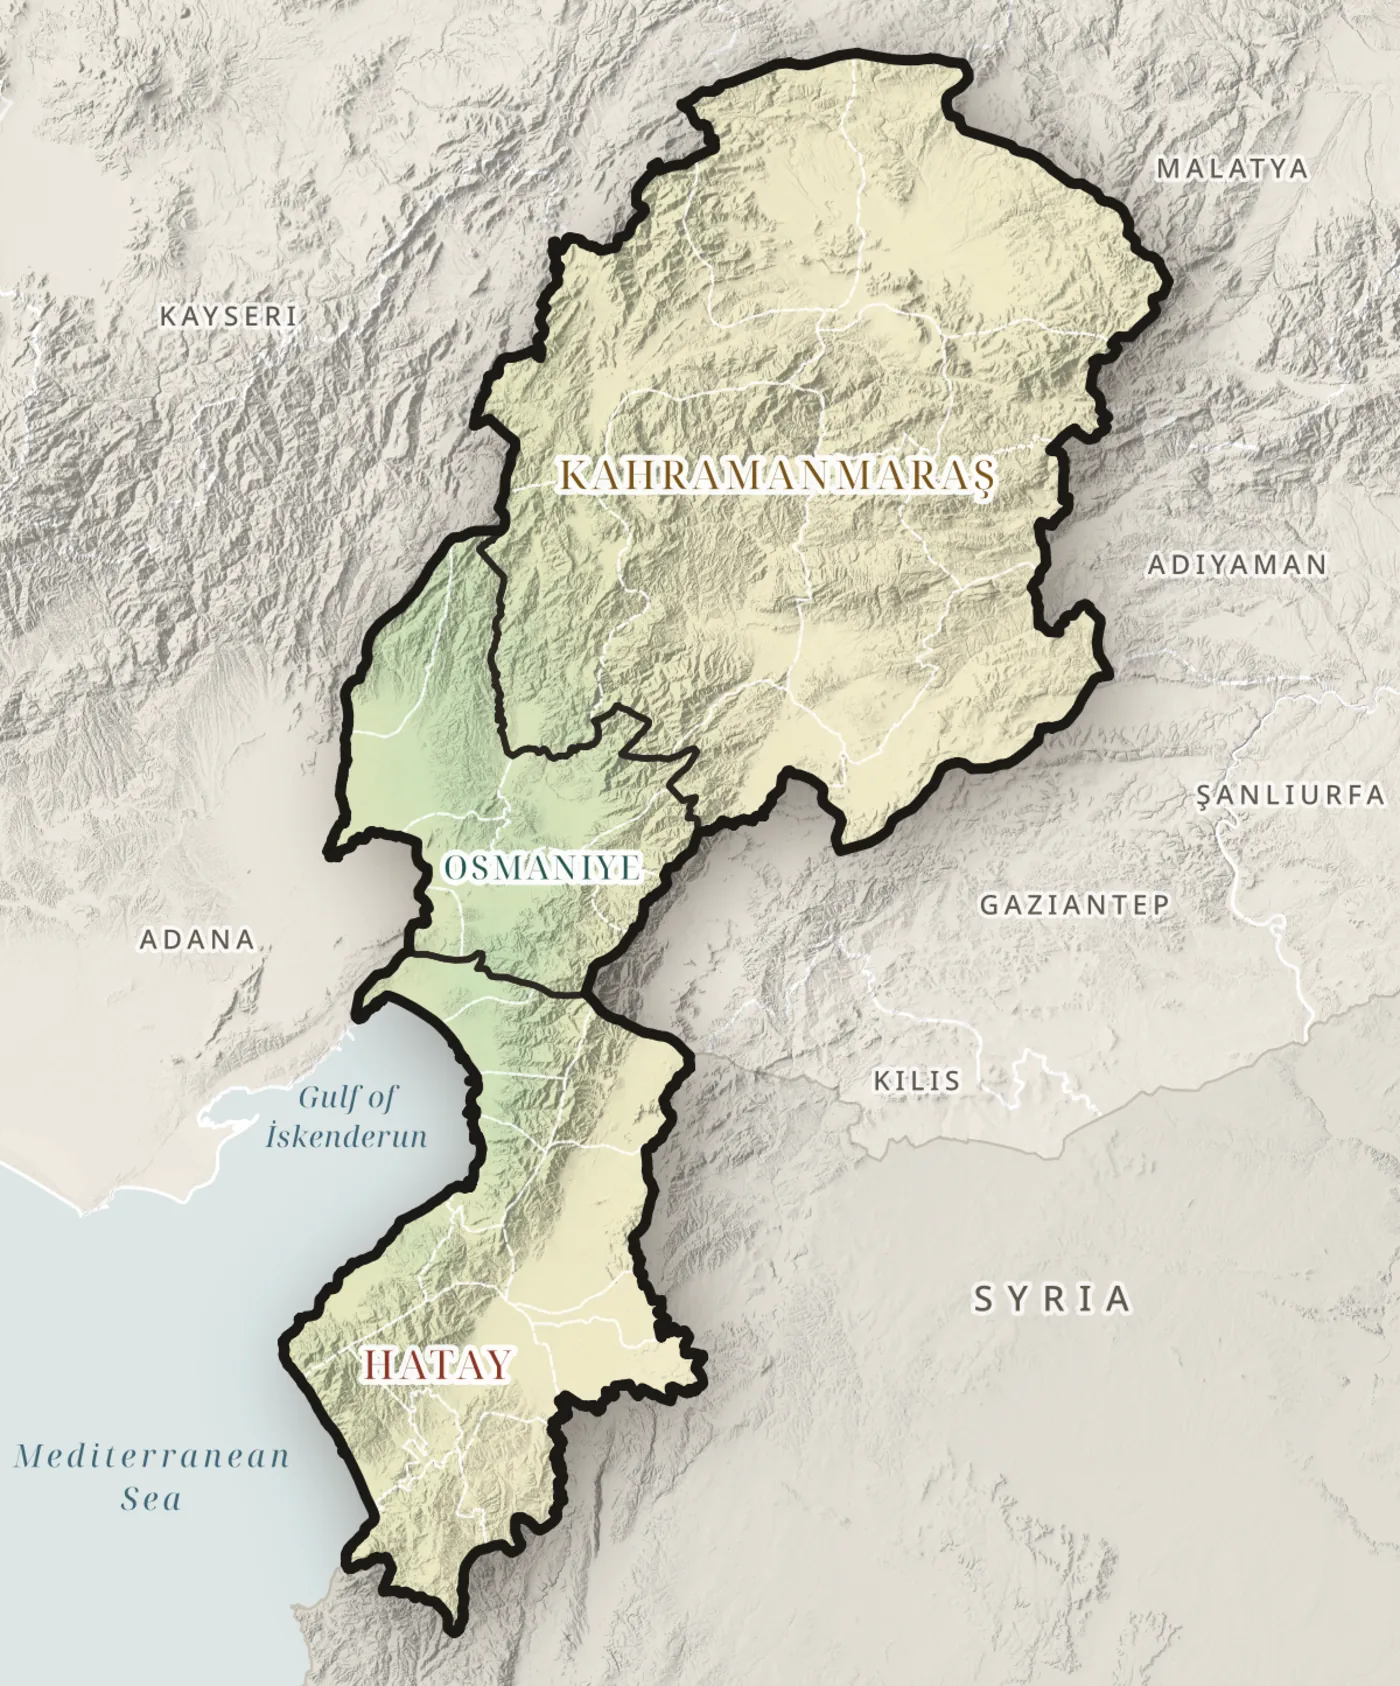
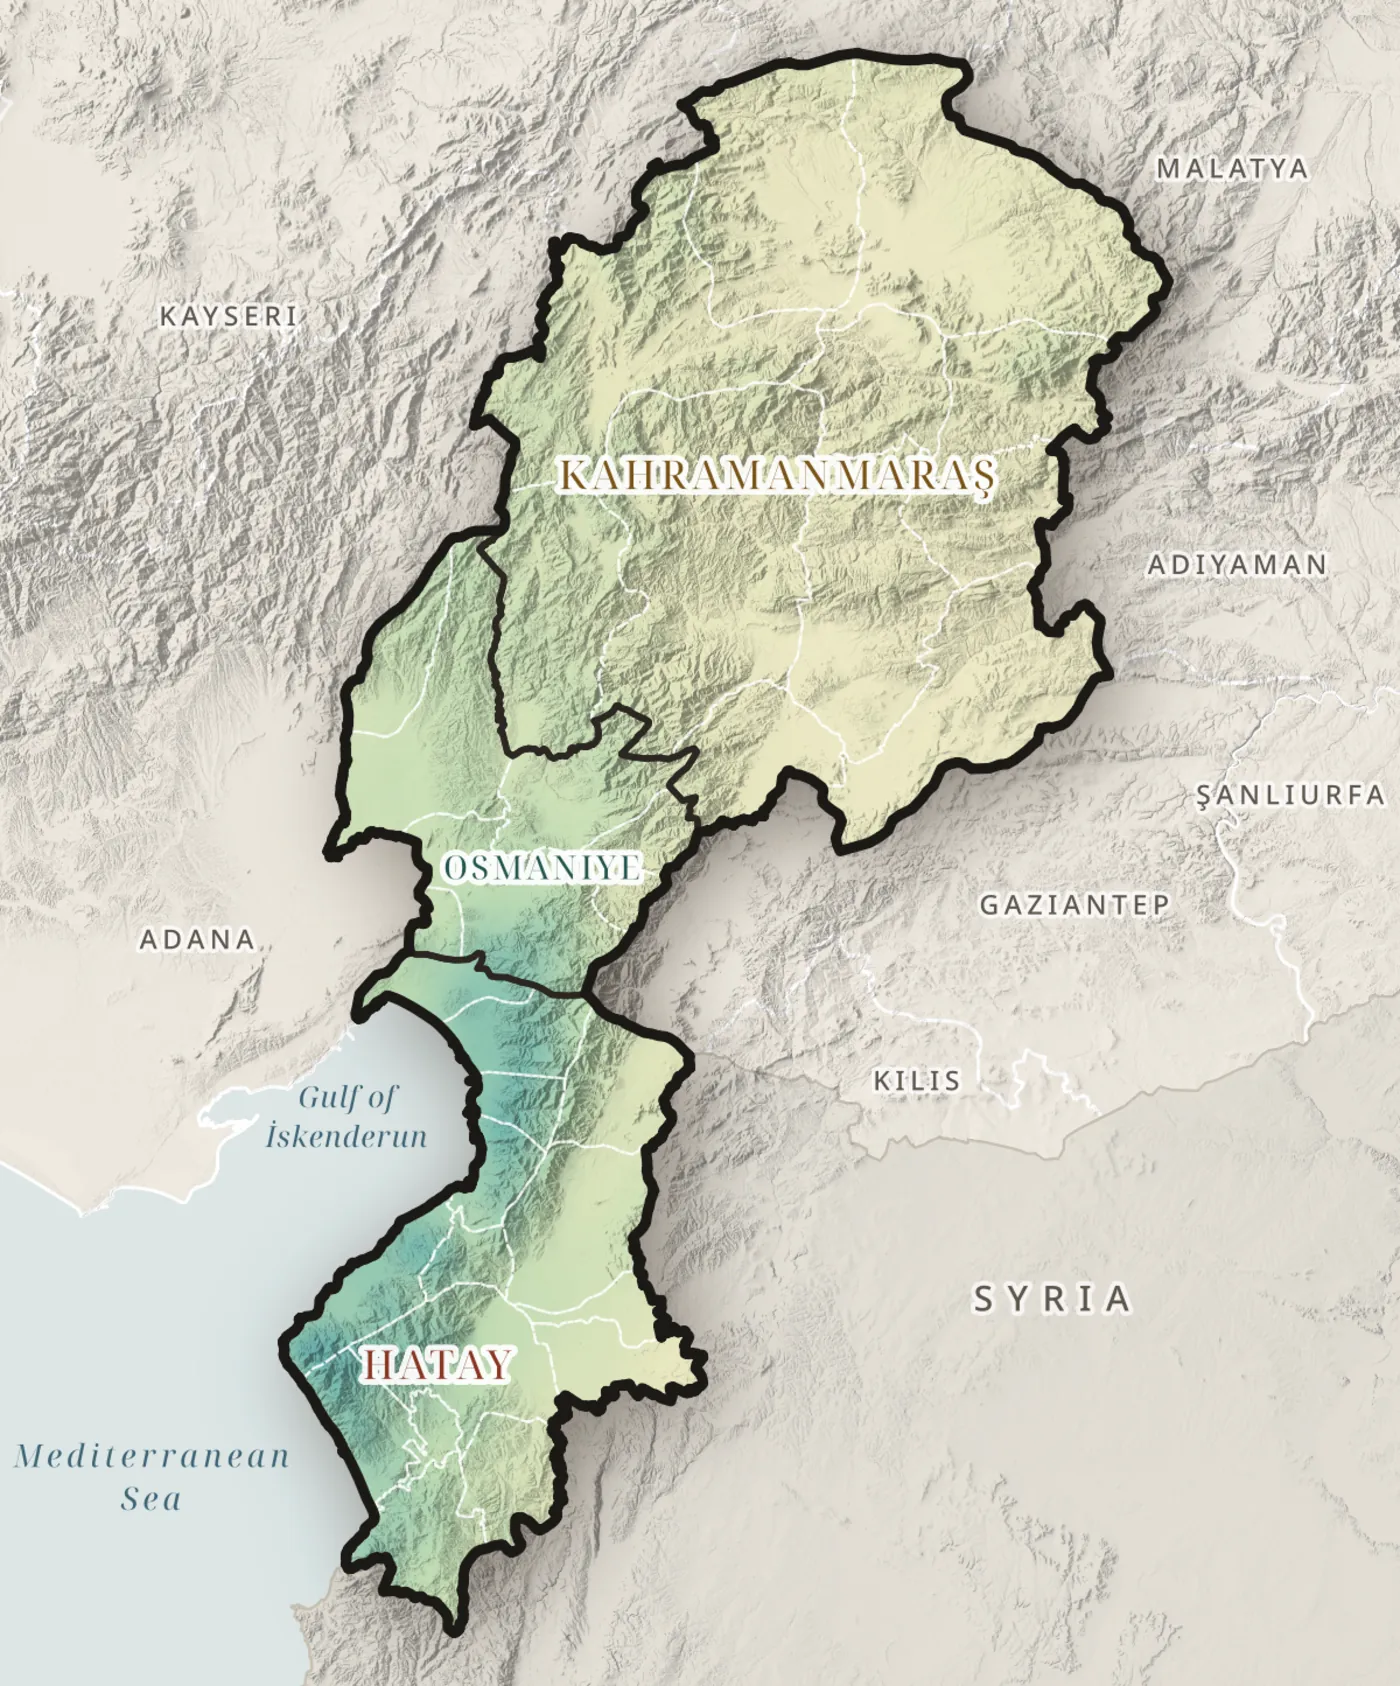
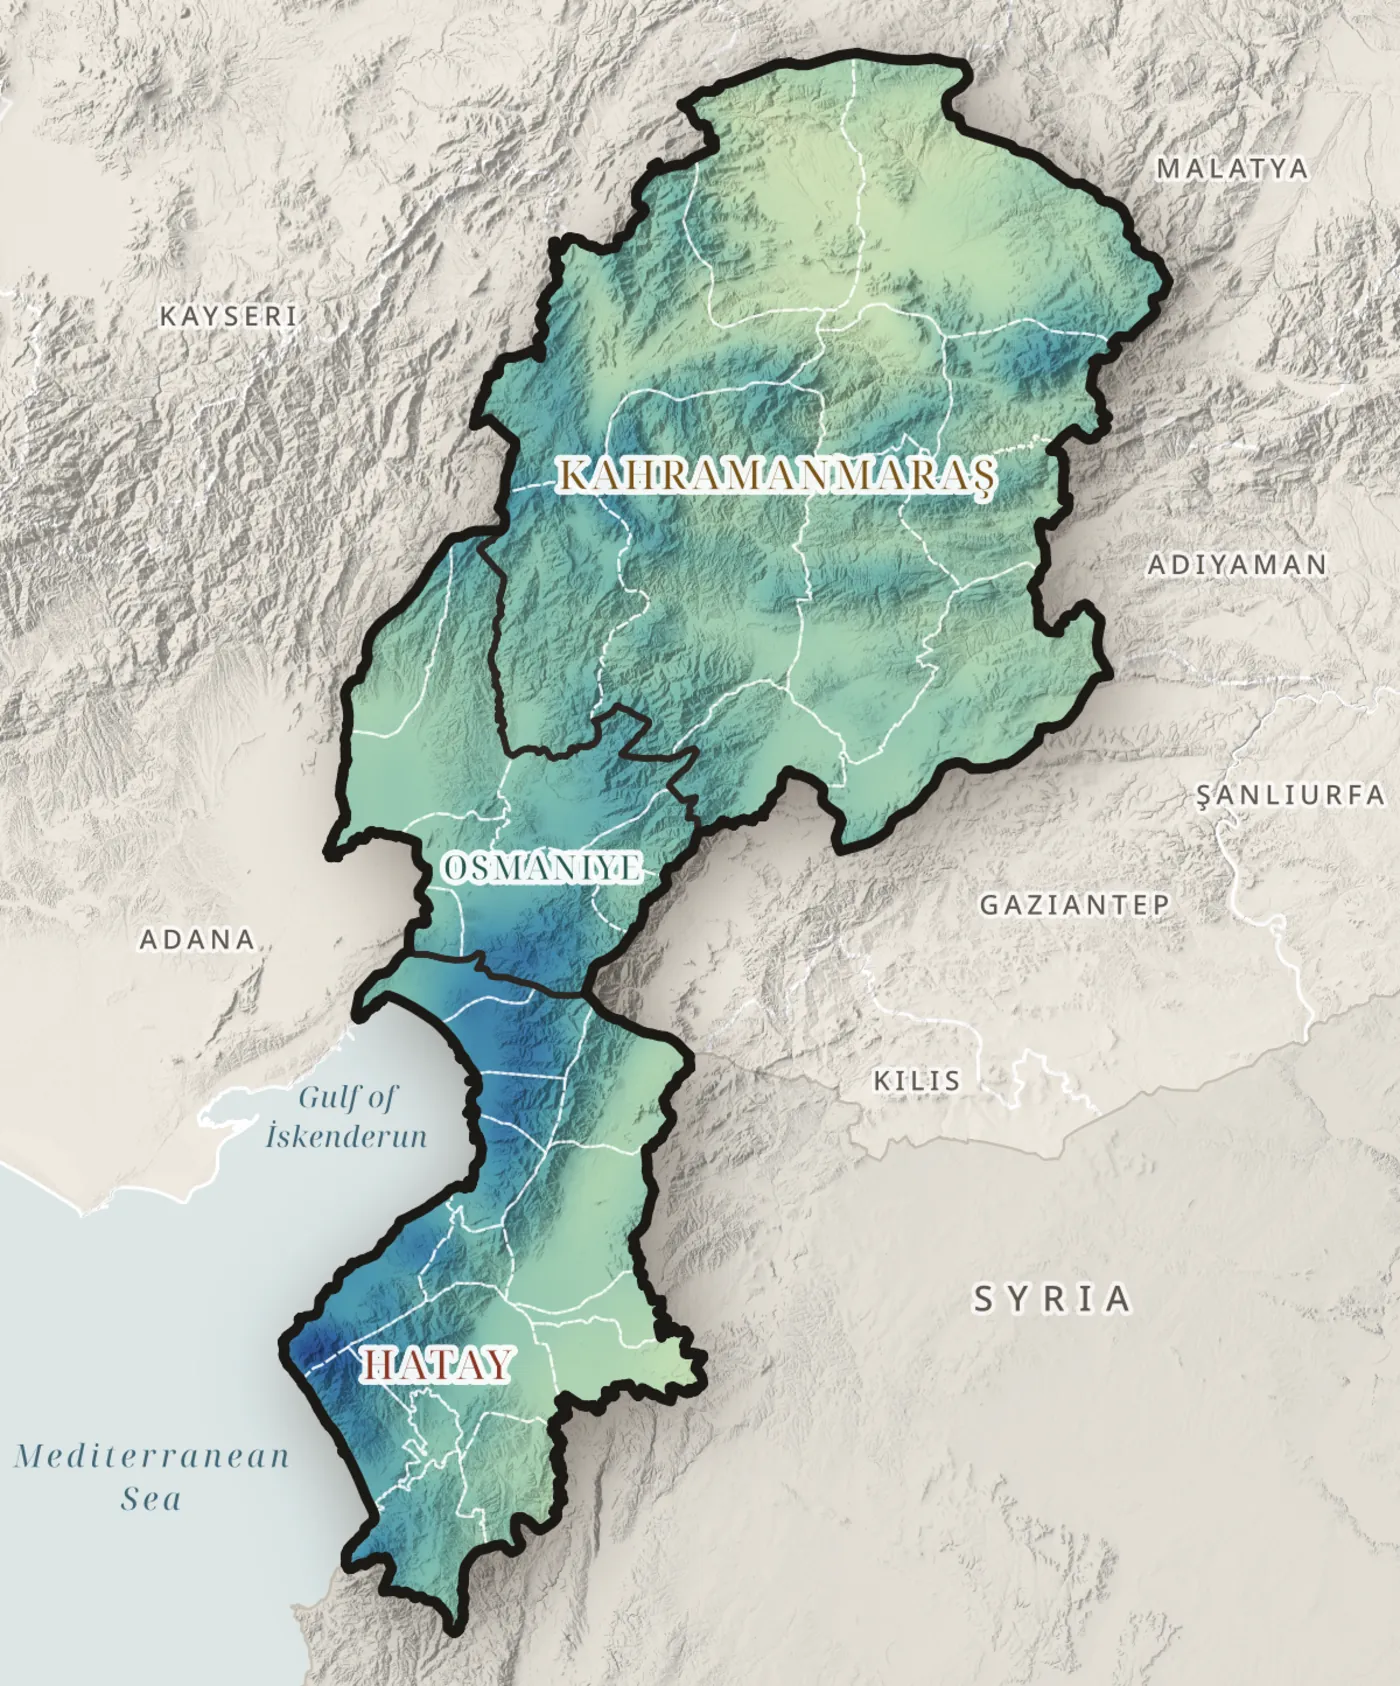
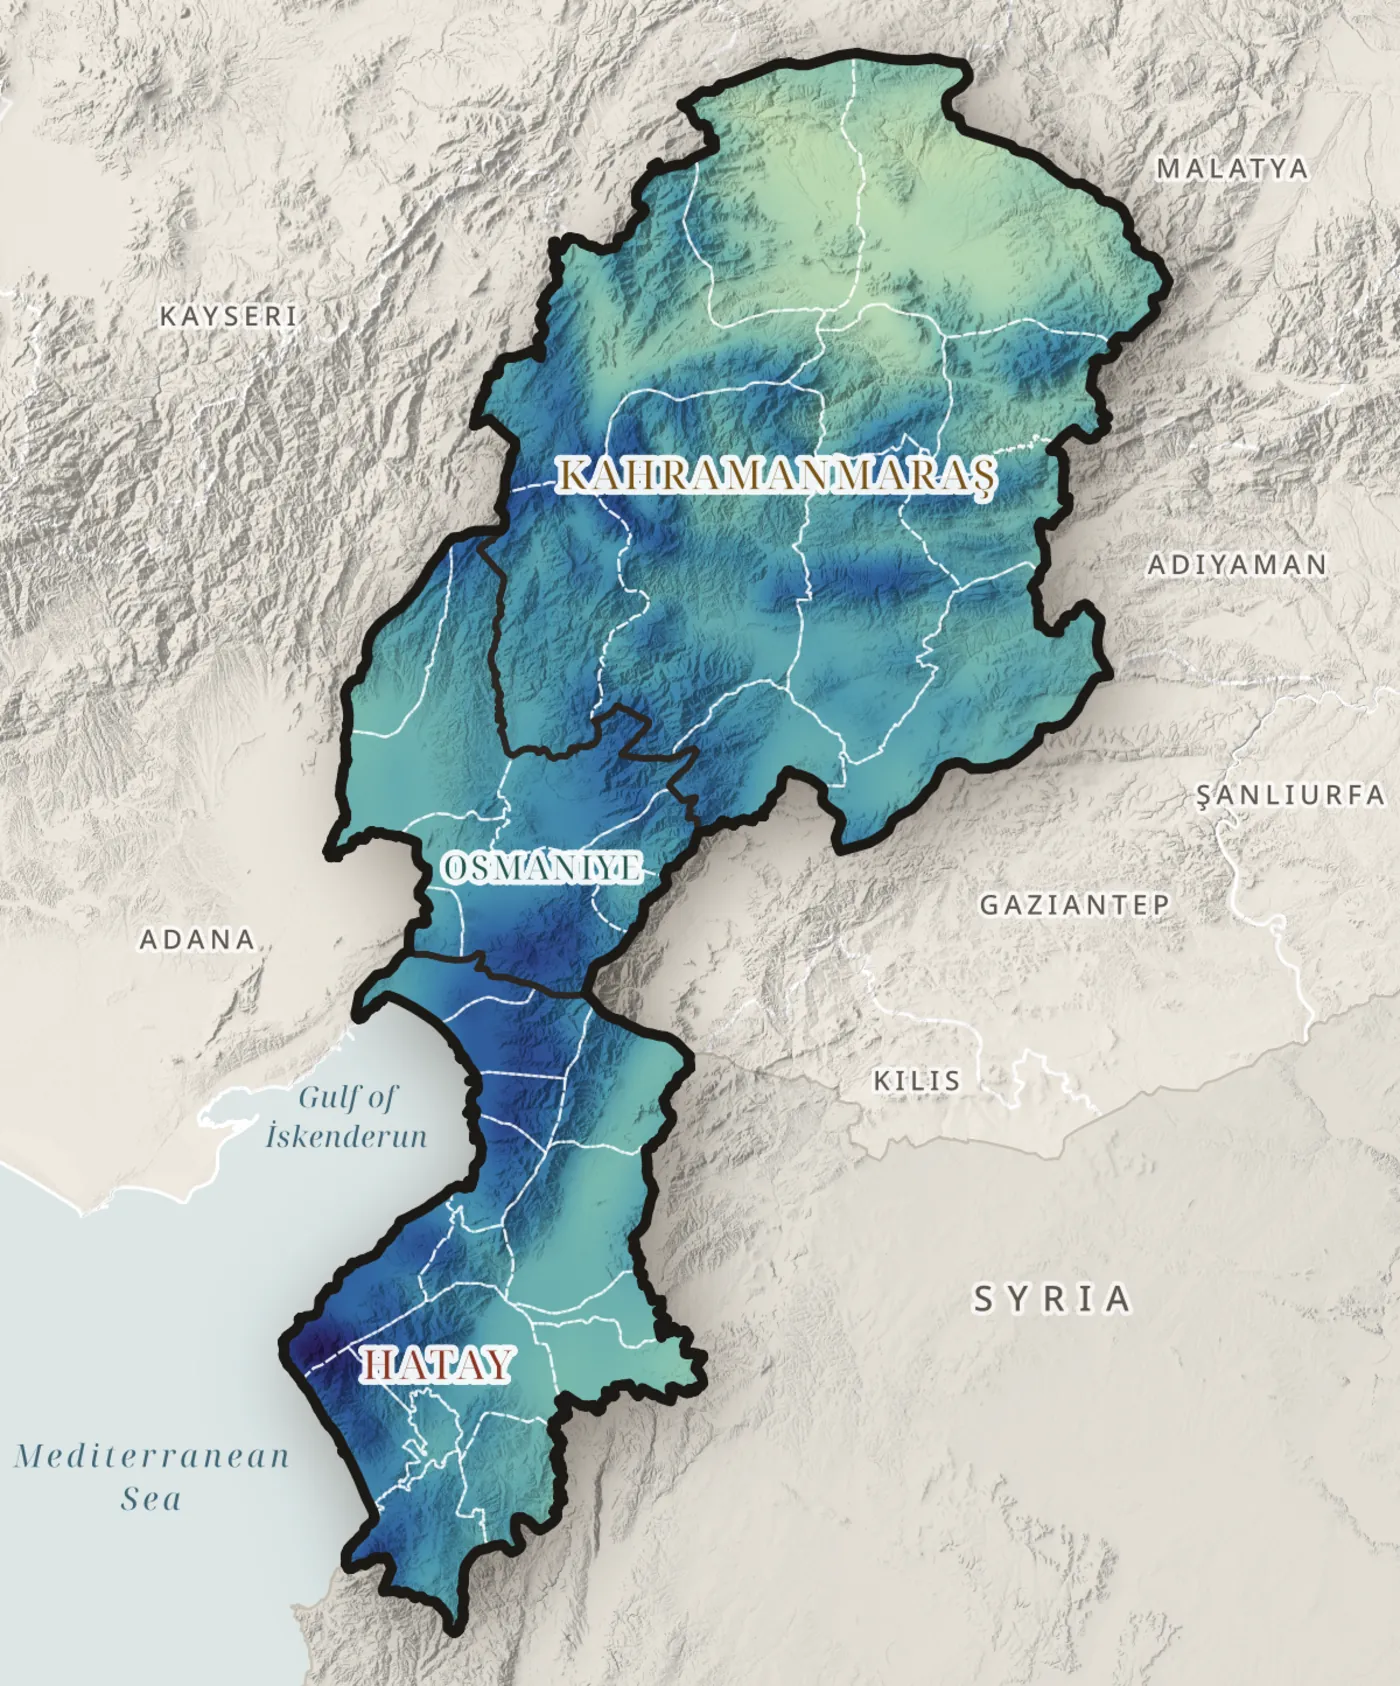
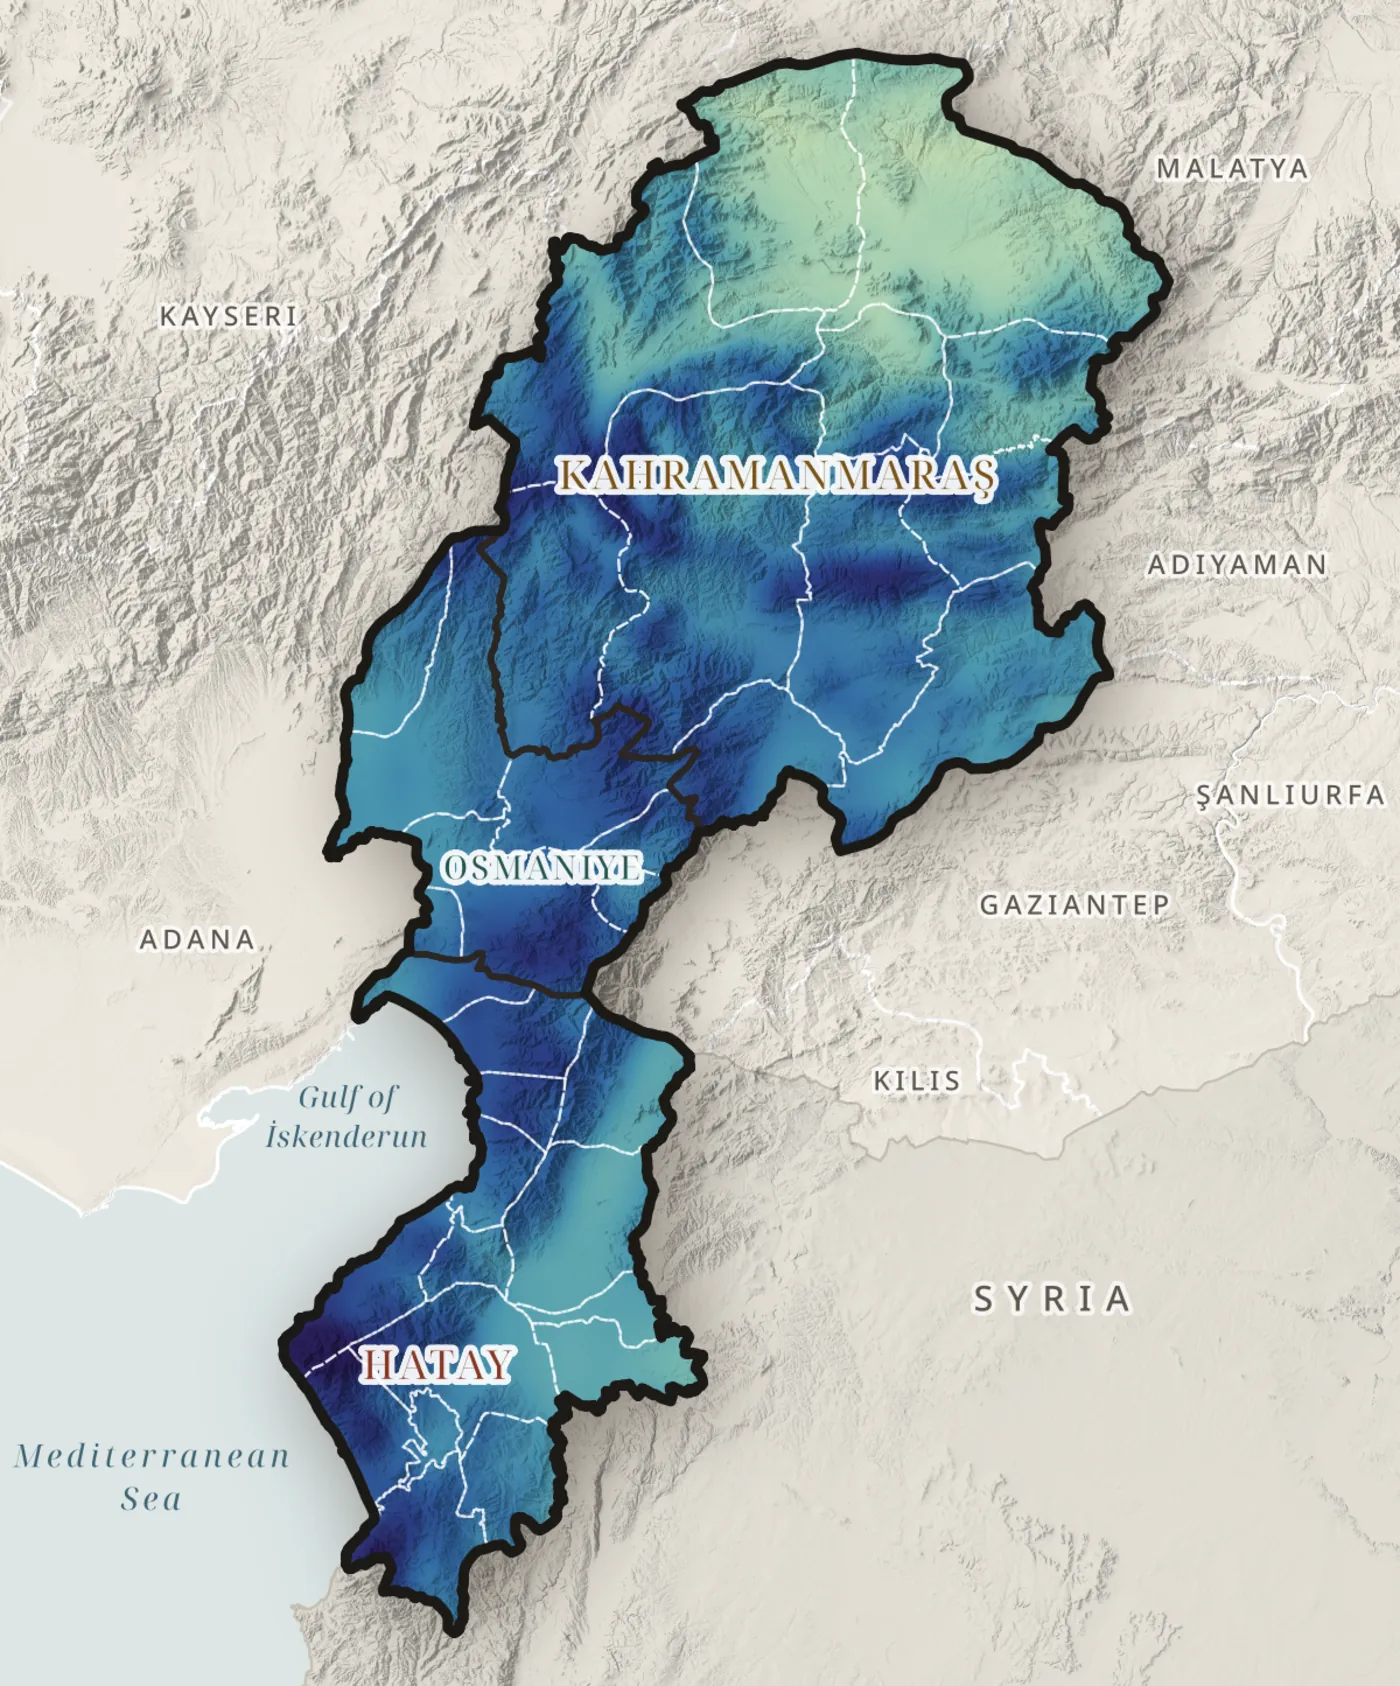
Precipitation through the year
January
0mm, region mean
CHELSA V2.1 monthly climatology, 1981–2010 · one colour scale for all months · Map C02
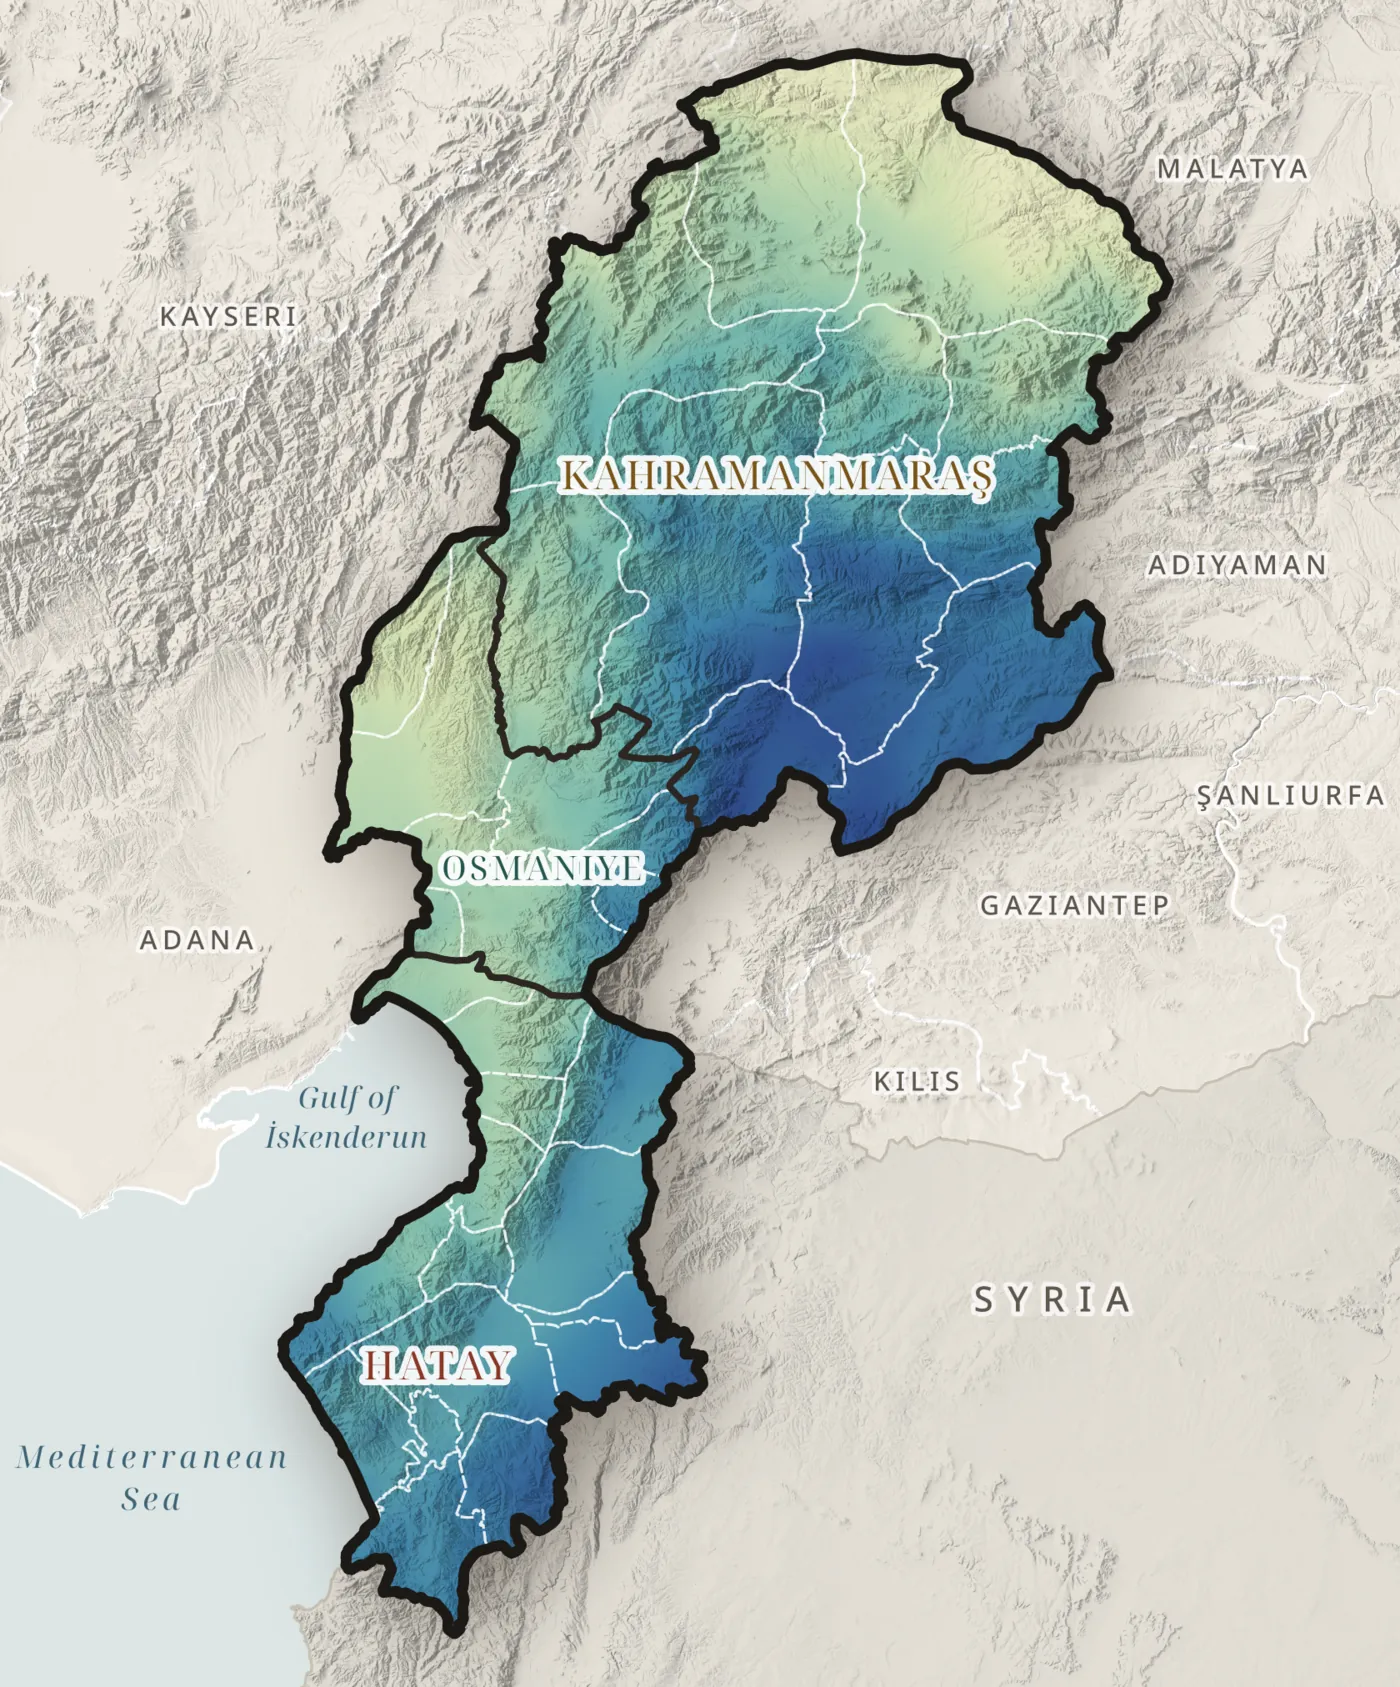
Seasonality
Three quarters of the year's water falls October to March
0% Oct–Mar
CHELSA V2.1, 1981–2010 · Map C05
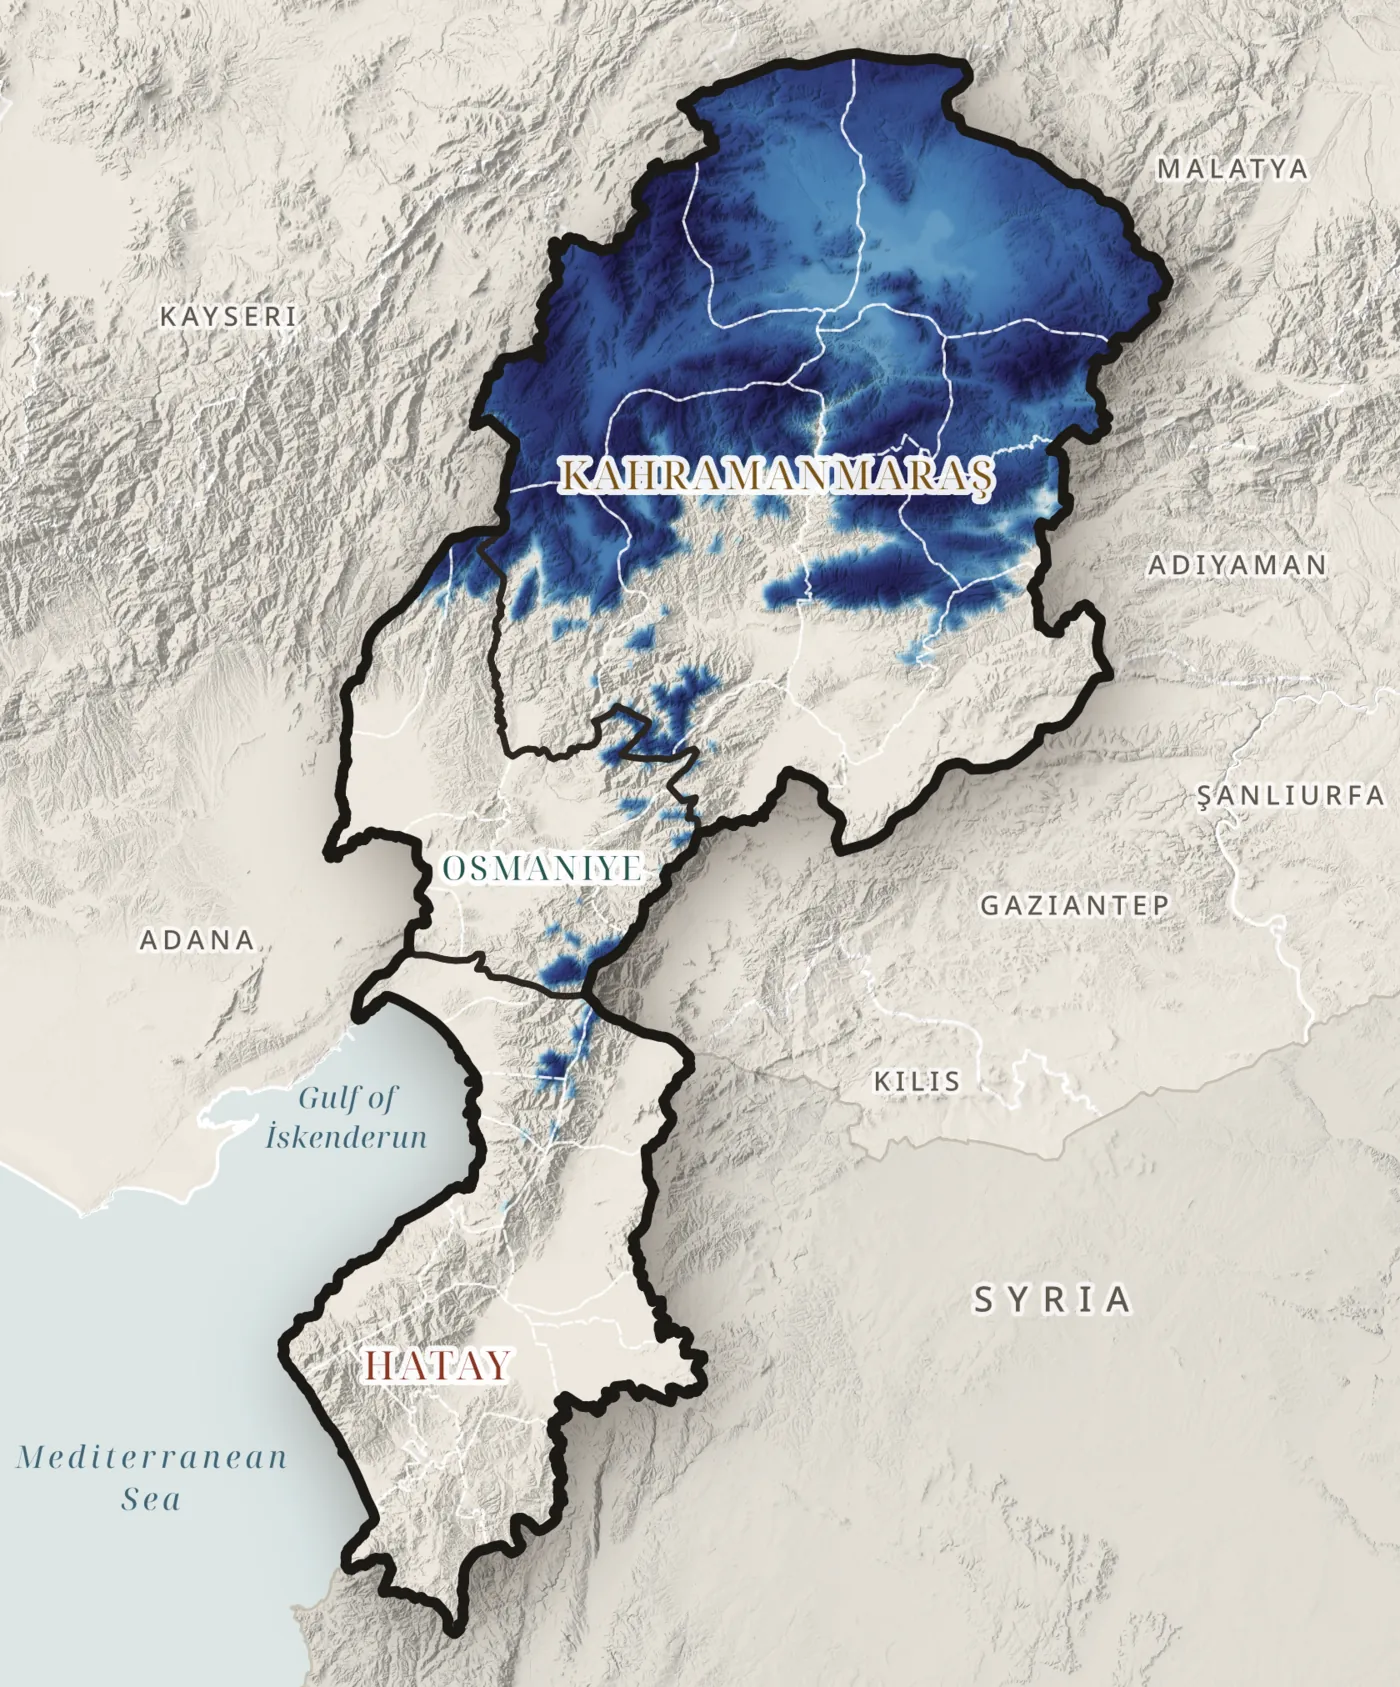
Snow
Snow above m feeds spring rivers
0km² with 30+ snow days
CHELSA V2.1 snow-cover days, 1981–2010 · Map C06
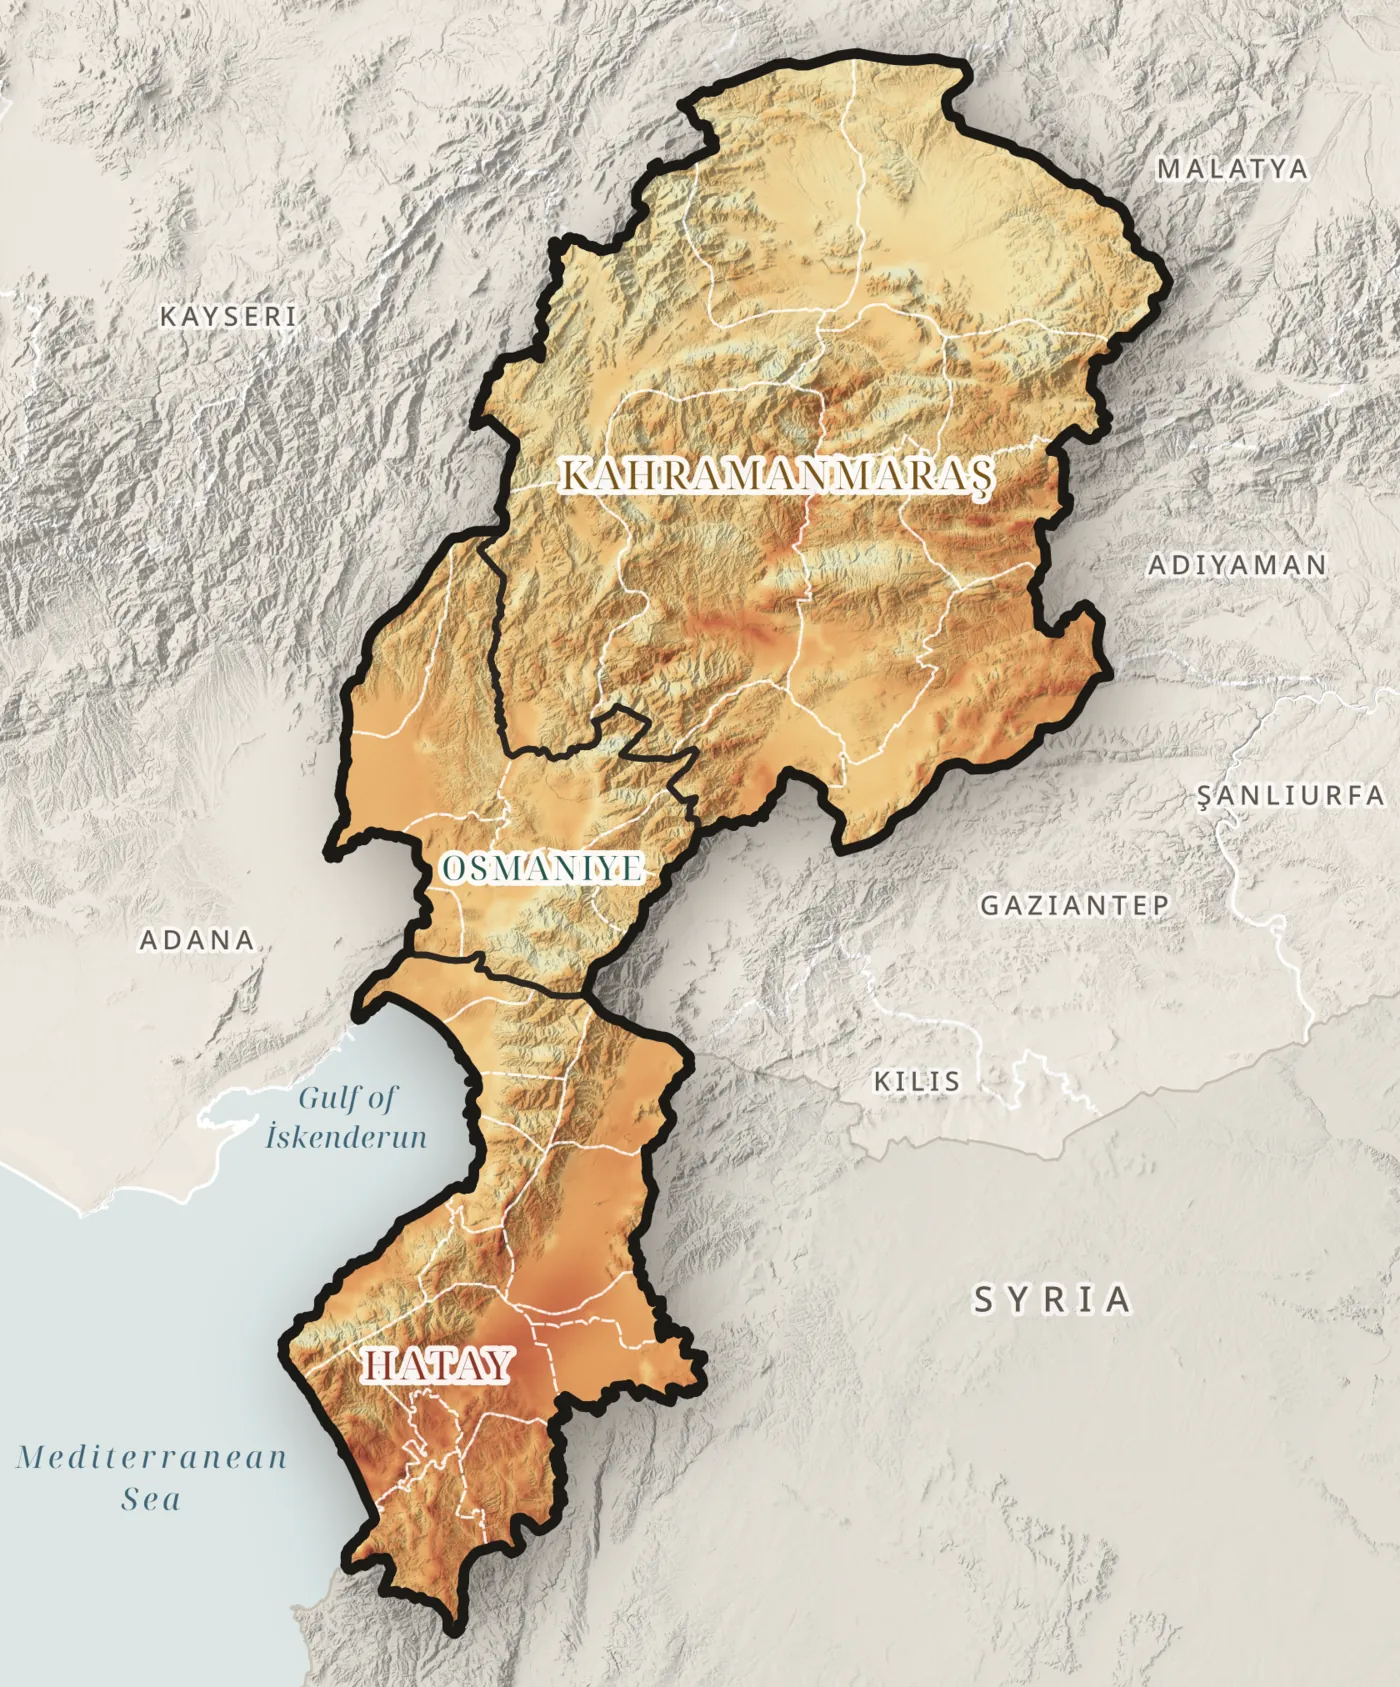
Evaporative demand
The air could evaporate more than all the rain
0mm PET a year
0mm precipitation
CHELSA V2.1, 1981–2010 · Map C08
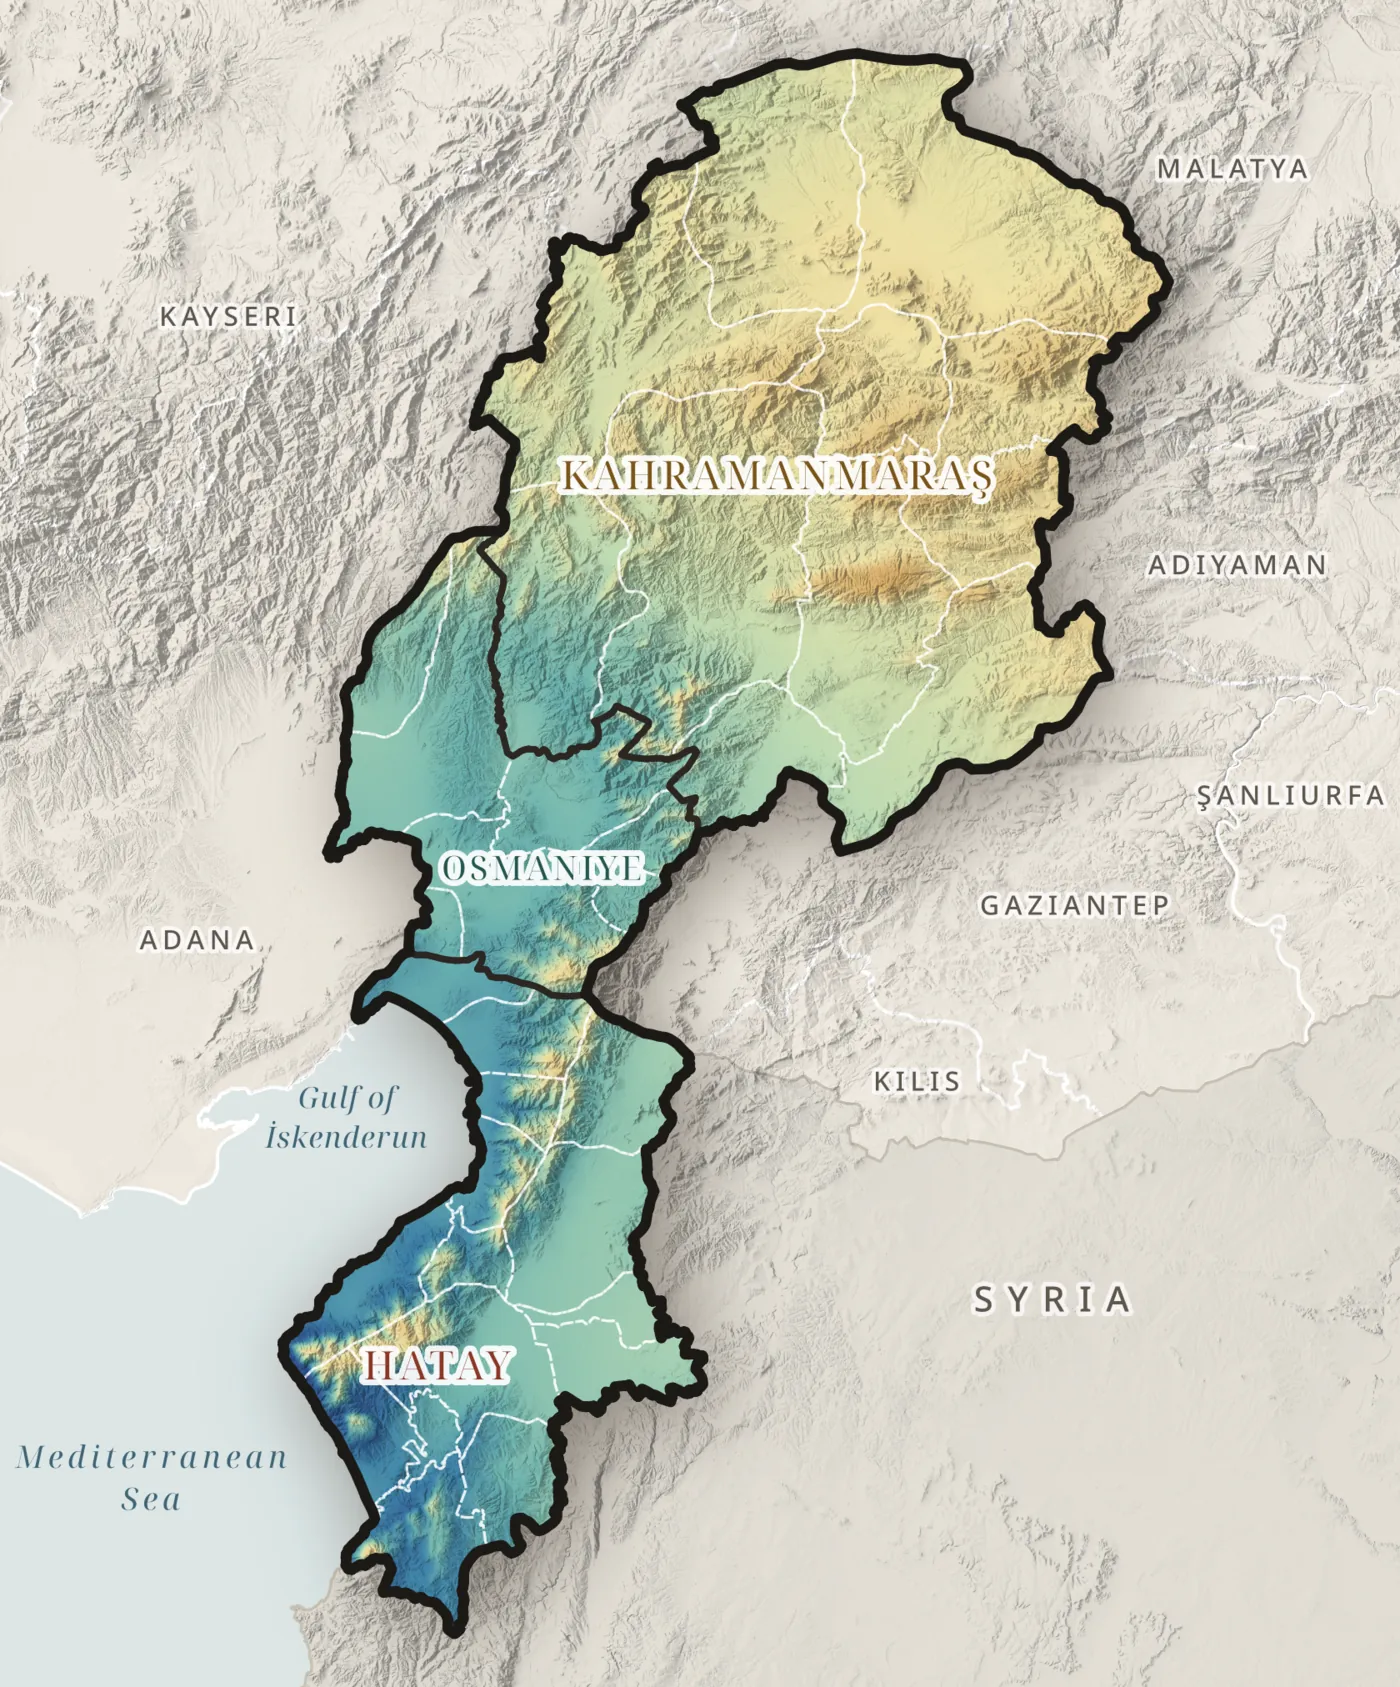
Summer humidity
Dry inland air pulls water from soil and crops
0% humidity in July
CHELSA V2.1, 1981–2010 · Map C10
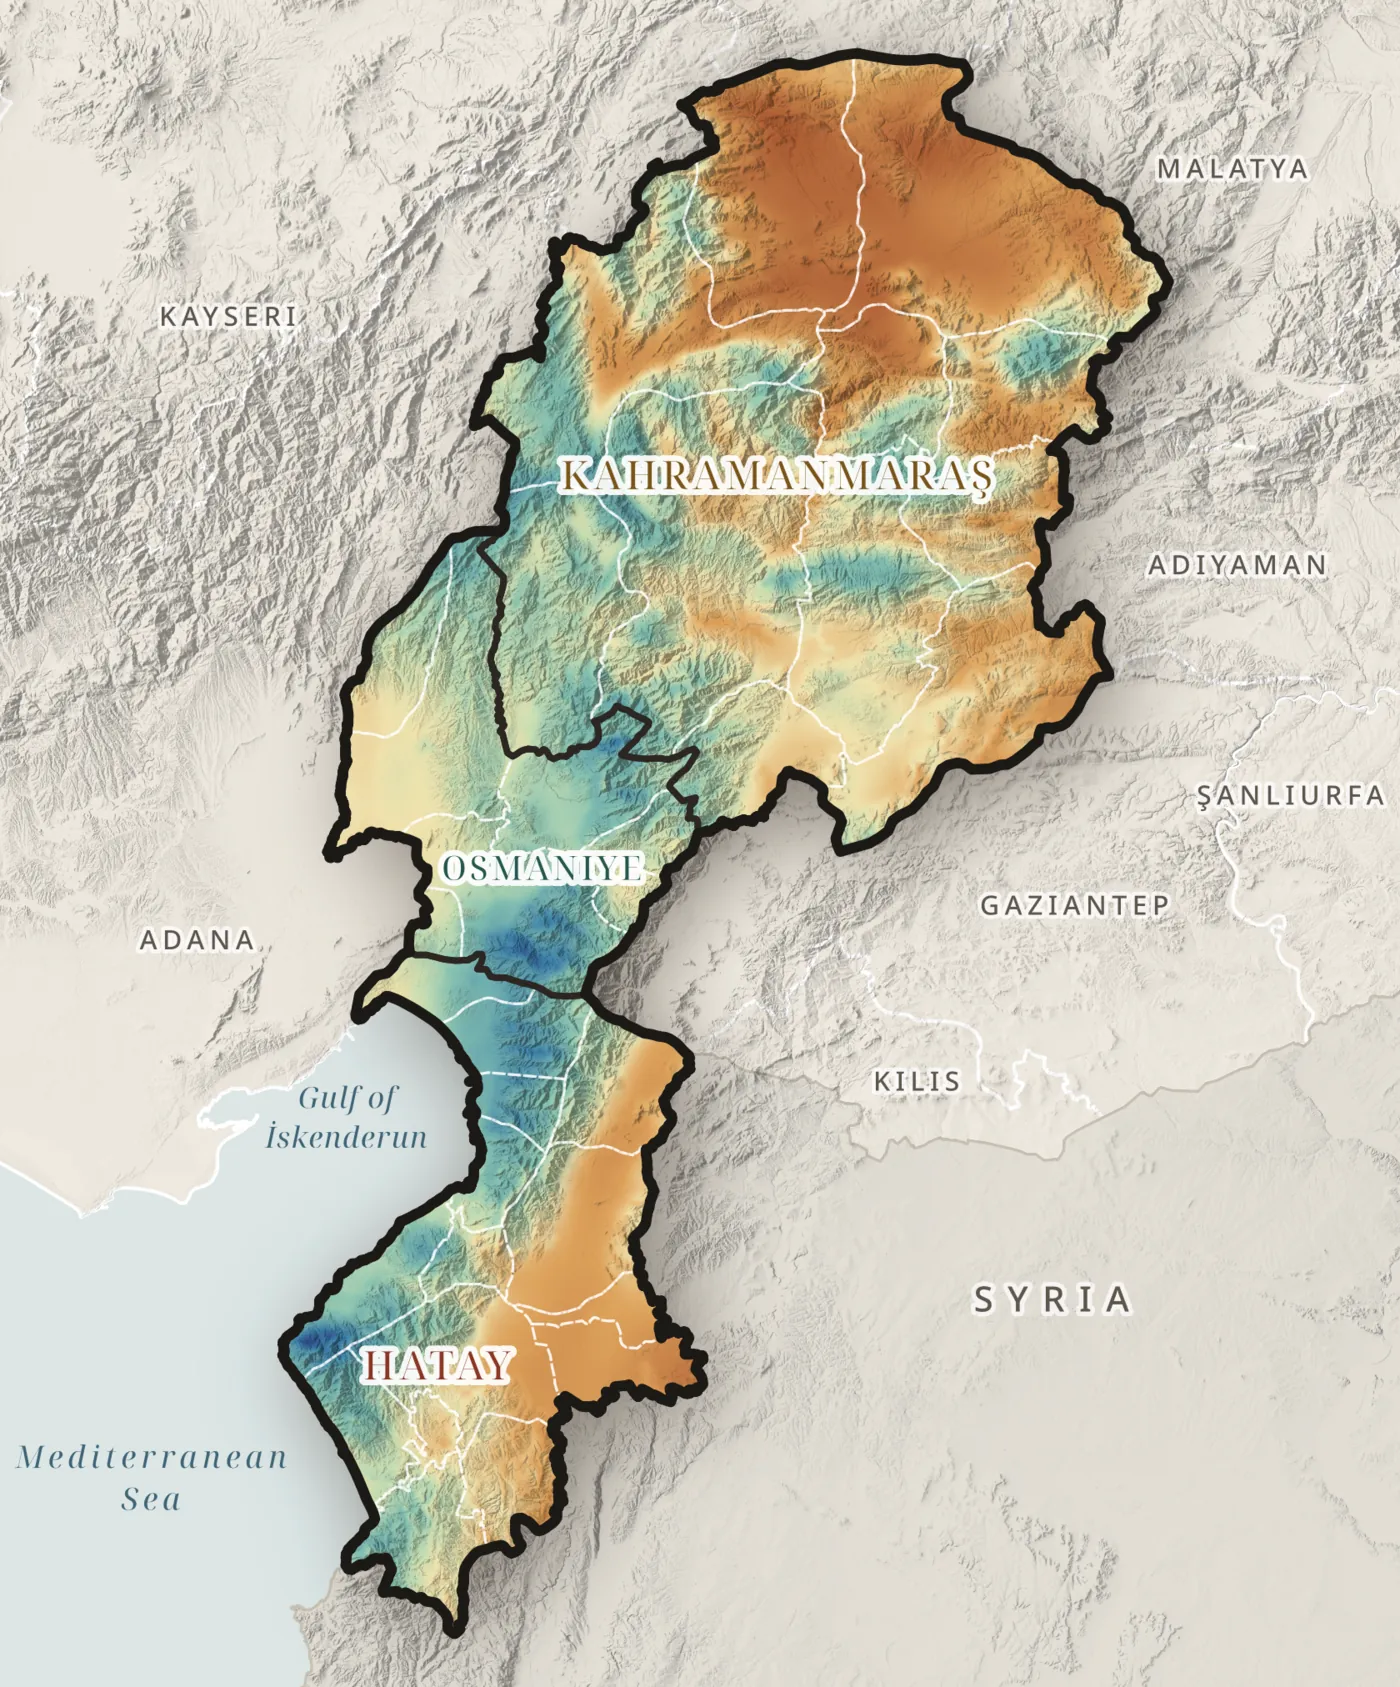
Aridity
Only the crests have water to spare
0aridity index
precipitation ÷ evaporative demand · below 1 means a yearly deficit
CHELSA V2.1, 1981–2010 · Map C09
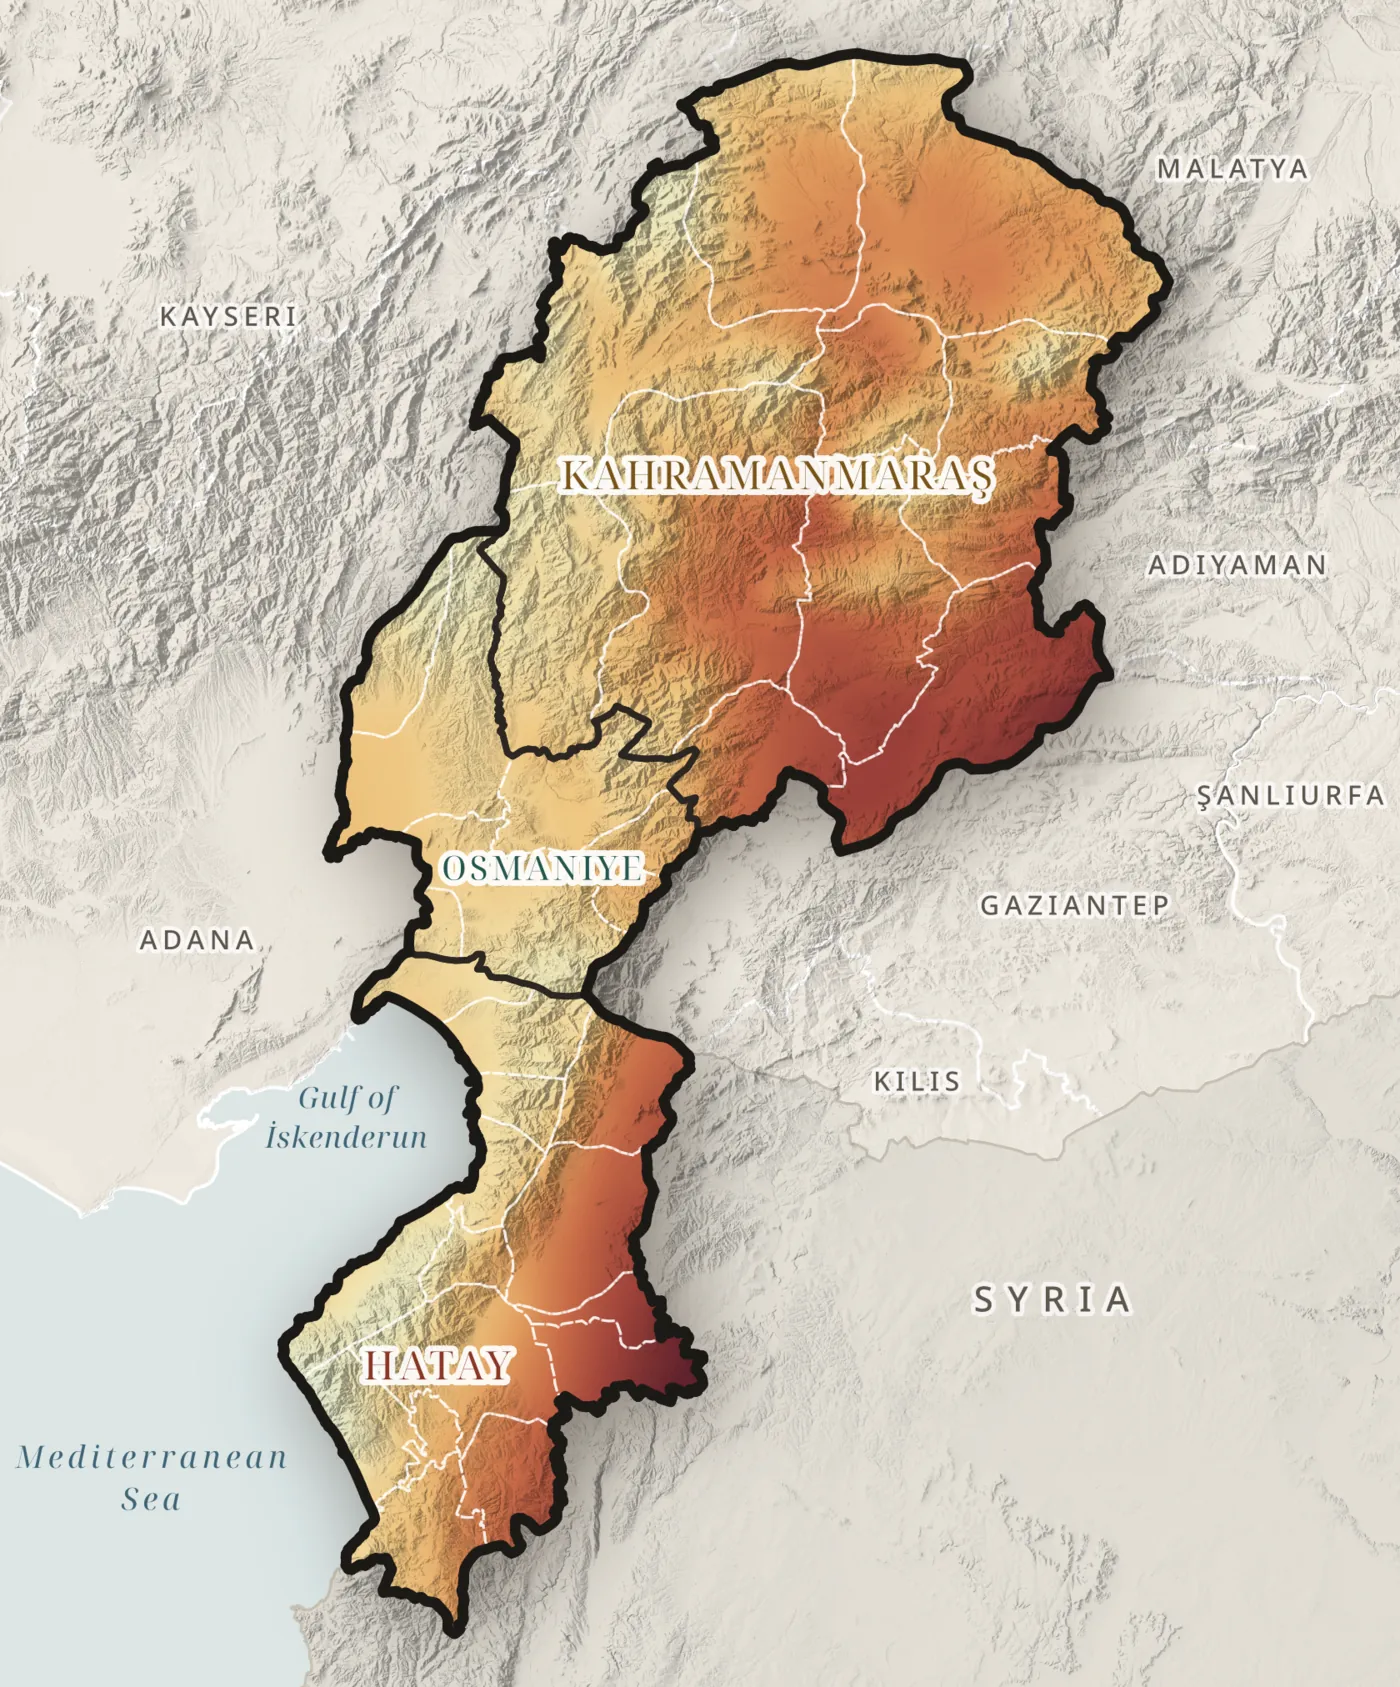
Climatic water deficit, 1991–2023
The deficit is getting larger
0mm more since 2007
TerraClimate (Abatzoglou et al., 2018) · Map T06
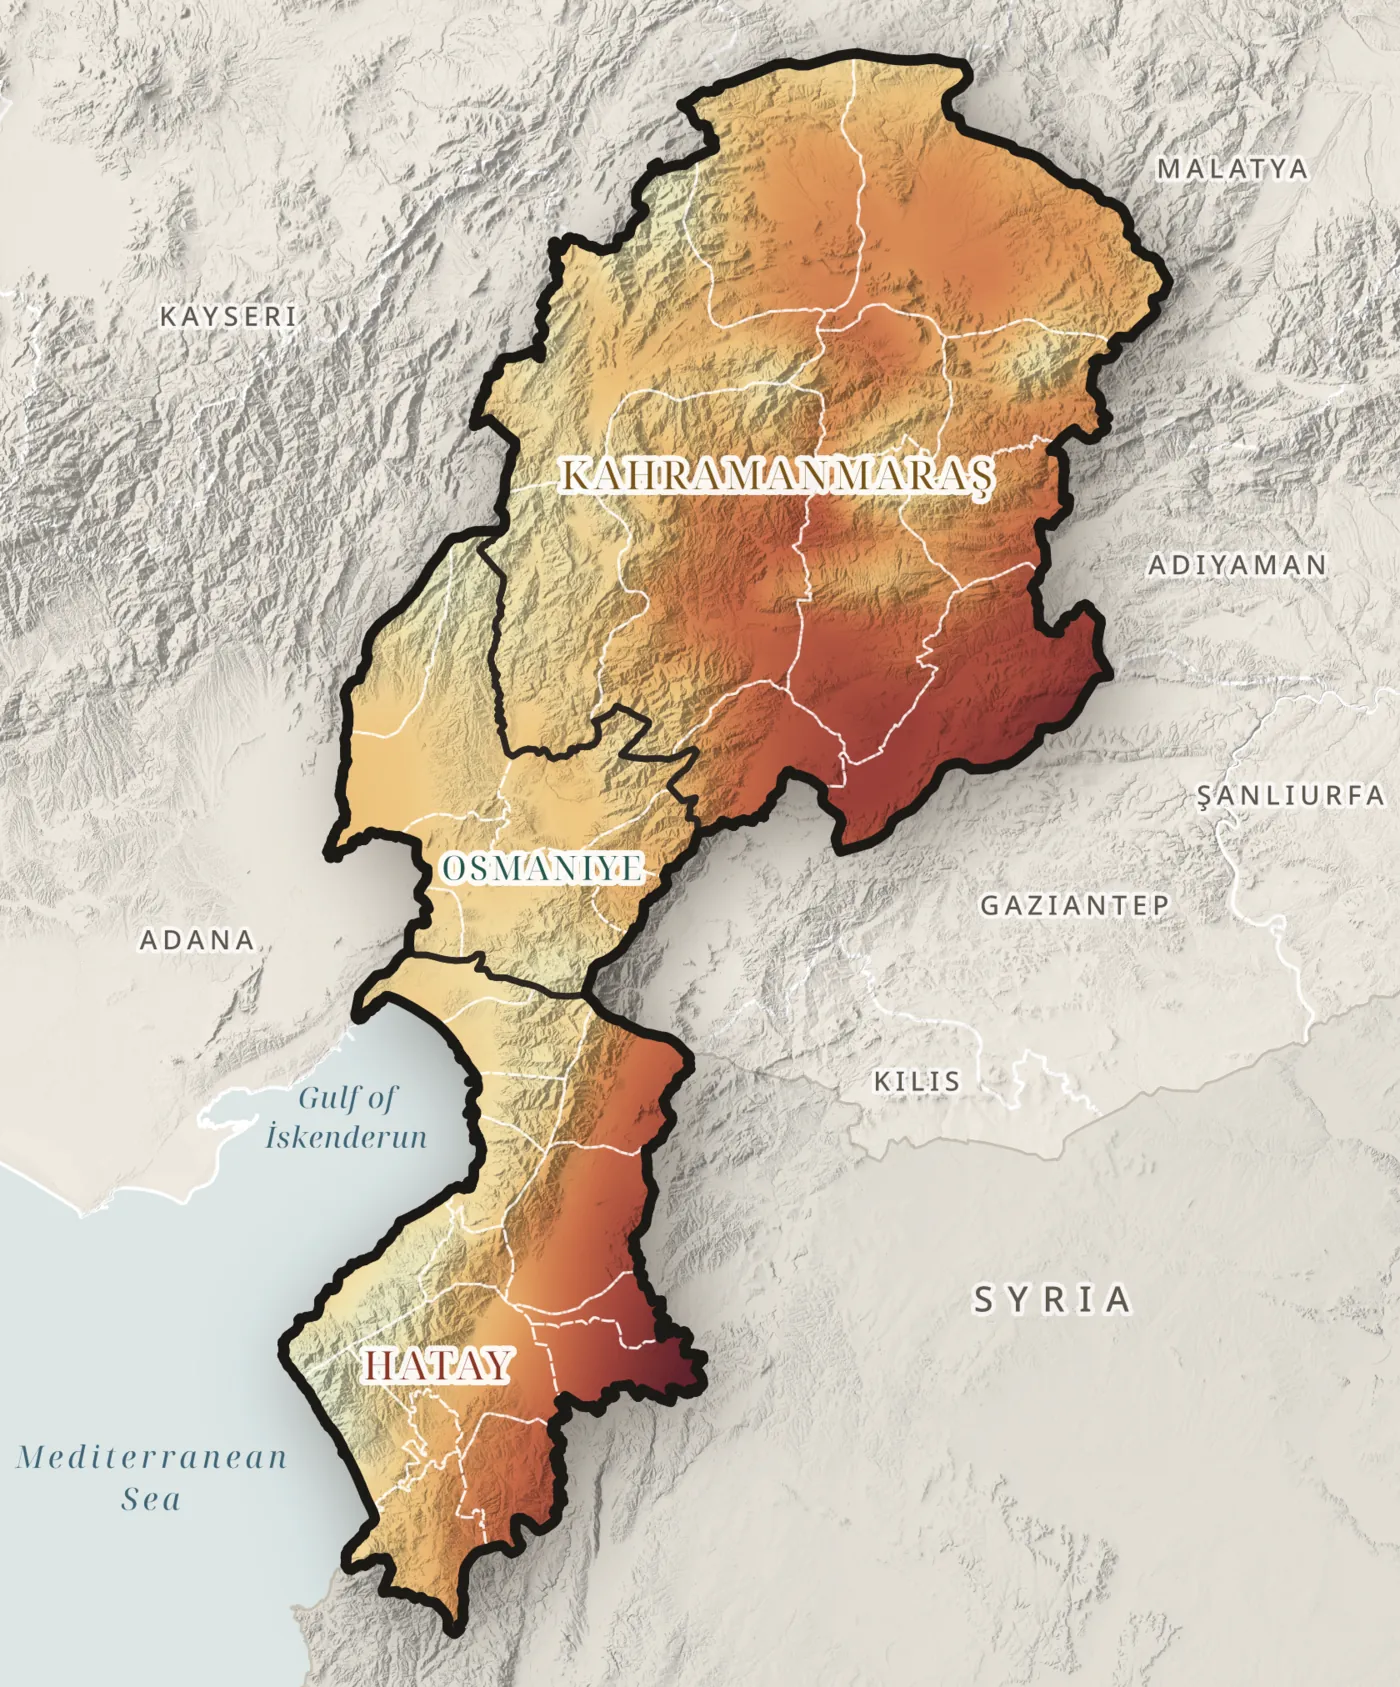
Drought stress
A third of the region is under drought stress
0% of the region
water deficit of 800 mm or more a year
TerraClimate, 1991–2023 · Map R12
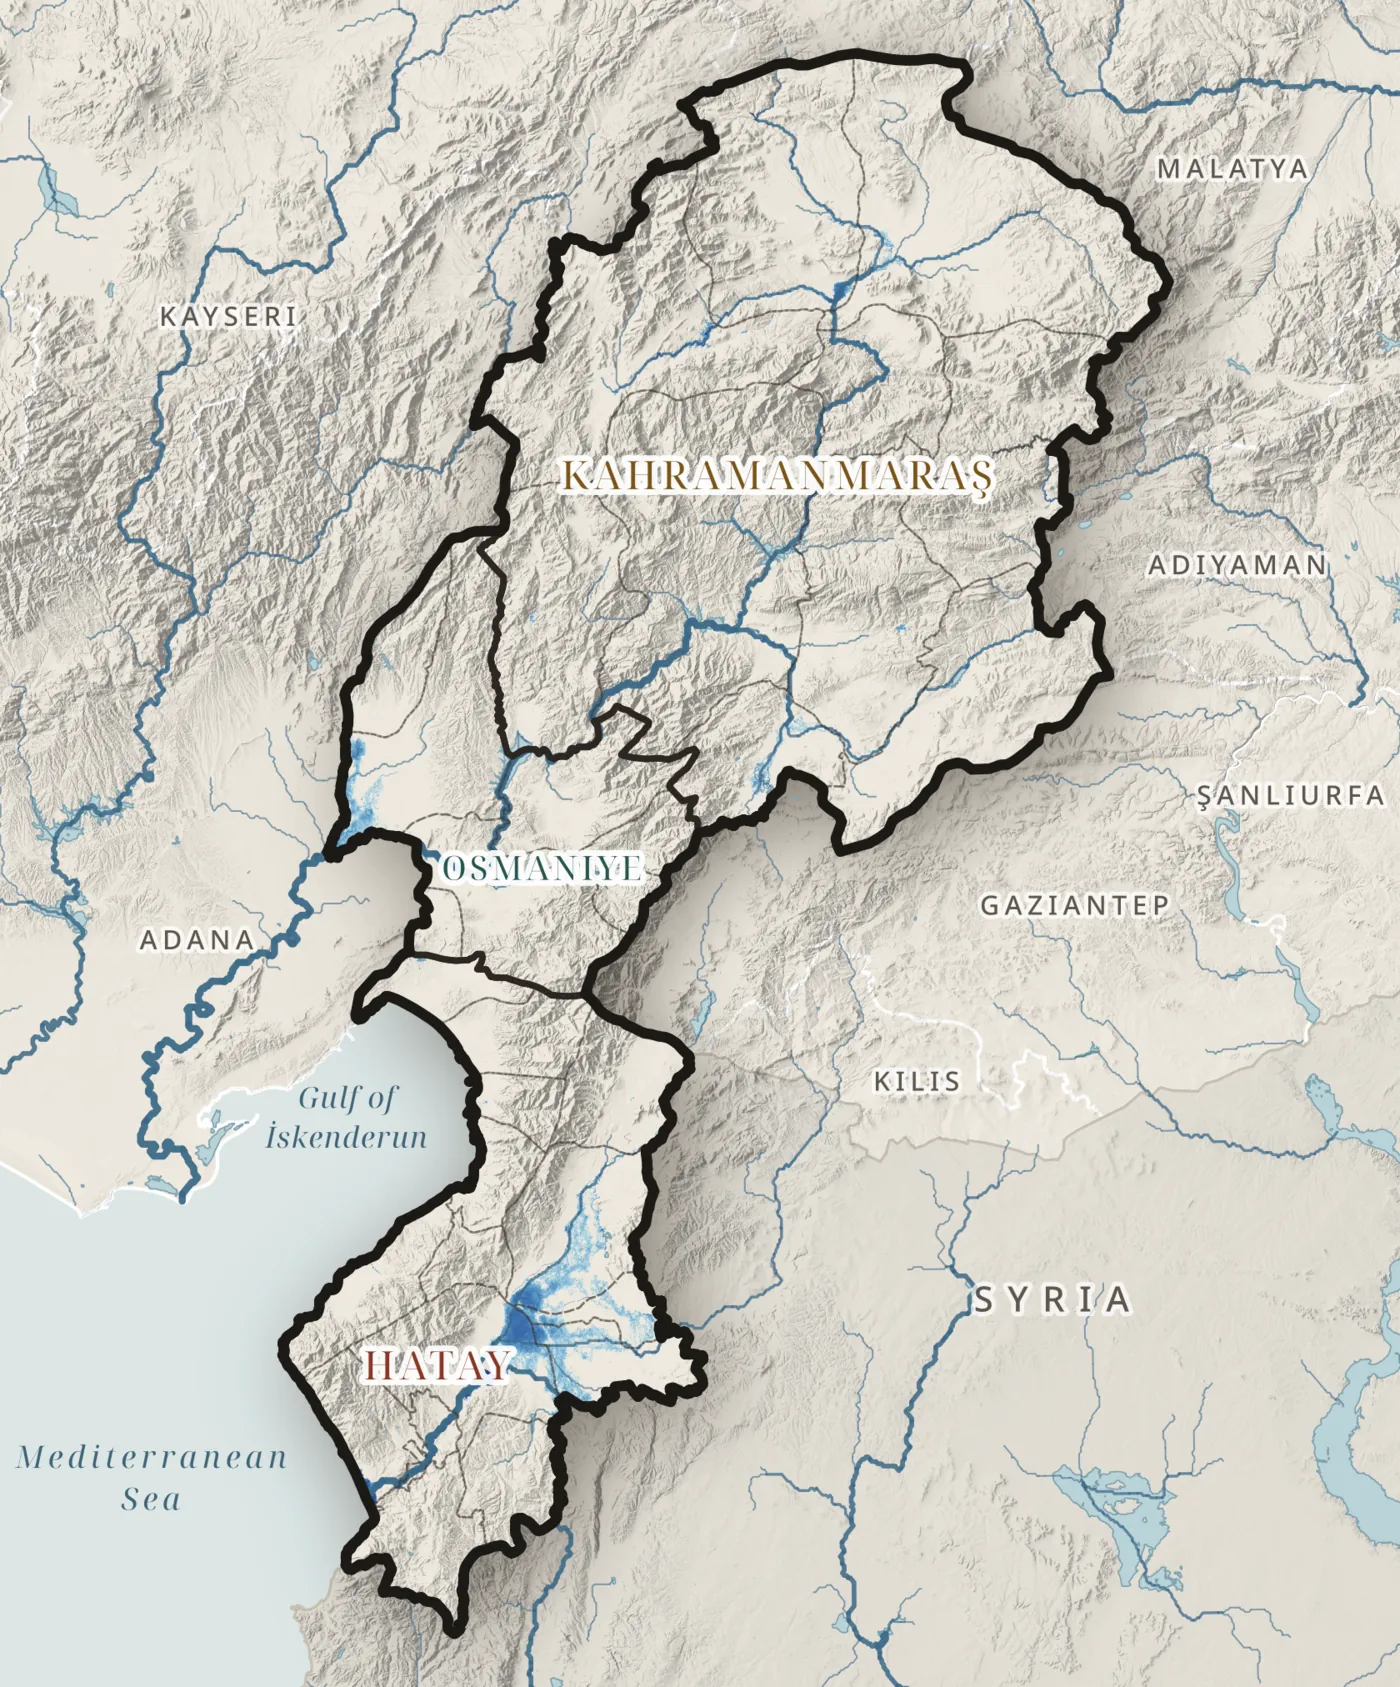
River flood · 1 in 100 years
Floods spread over the flat plains
0km² under water
JRC Global River Flood Hazard Maps (Baugh et al., 2024) · Map R07
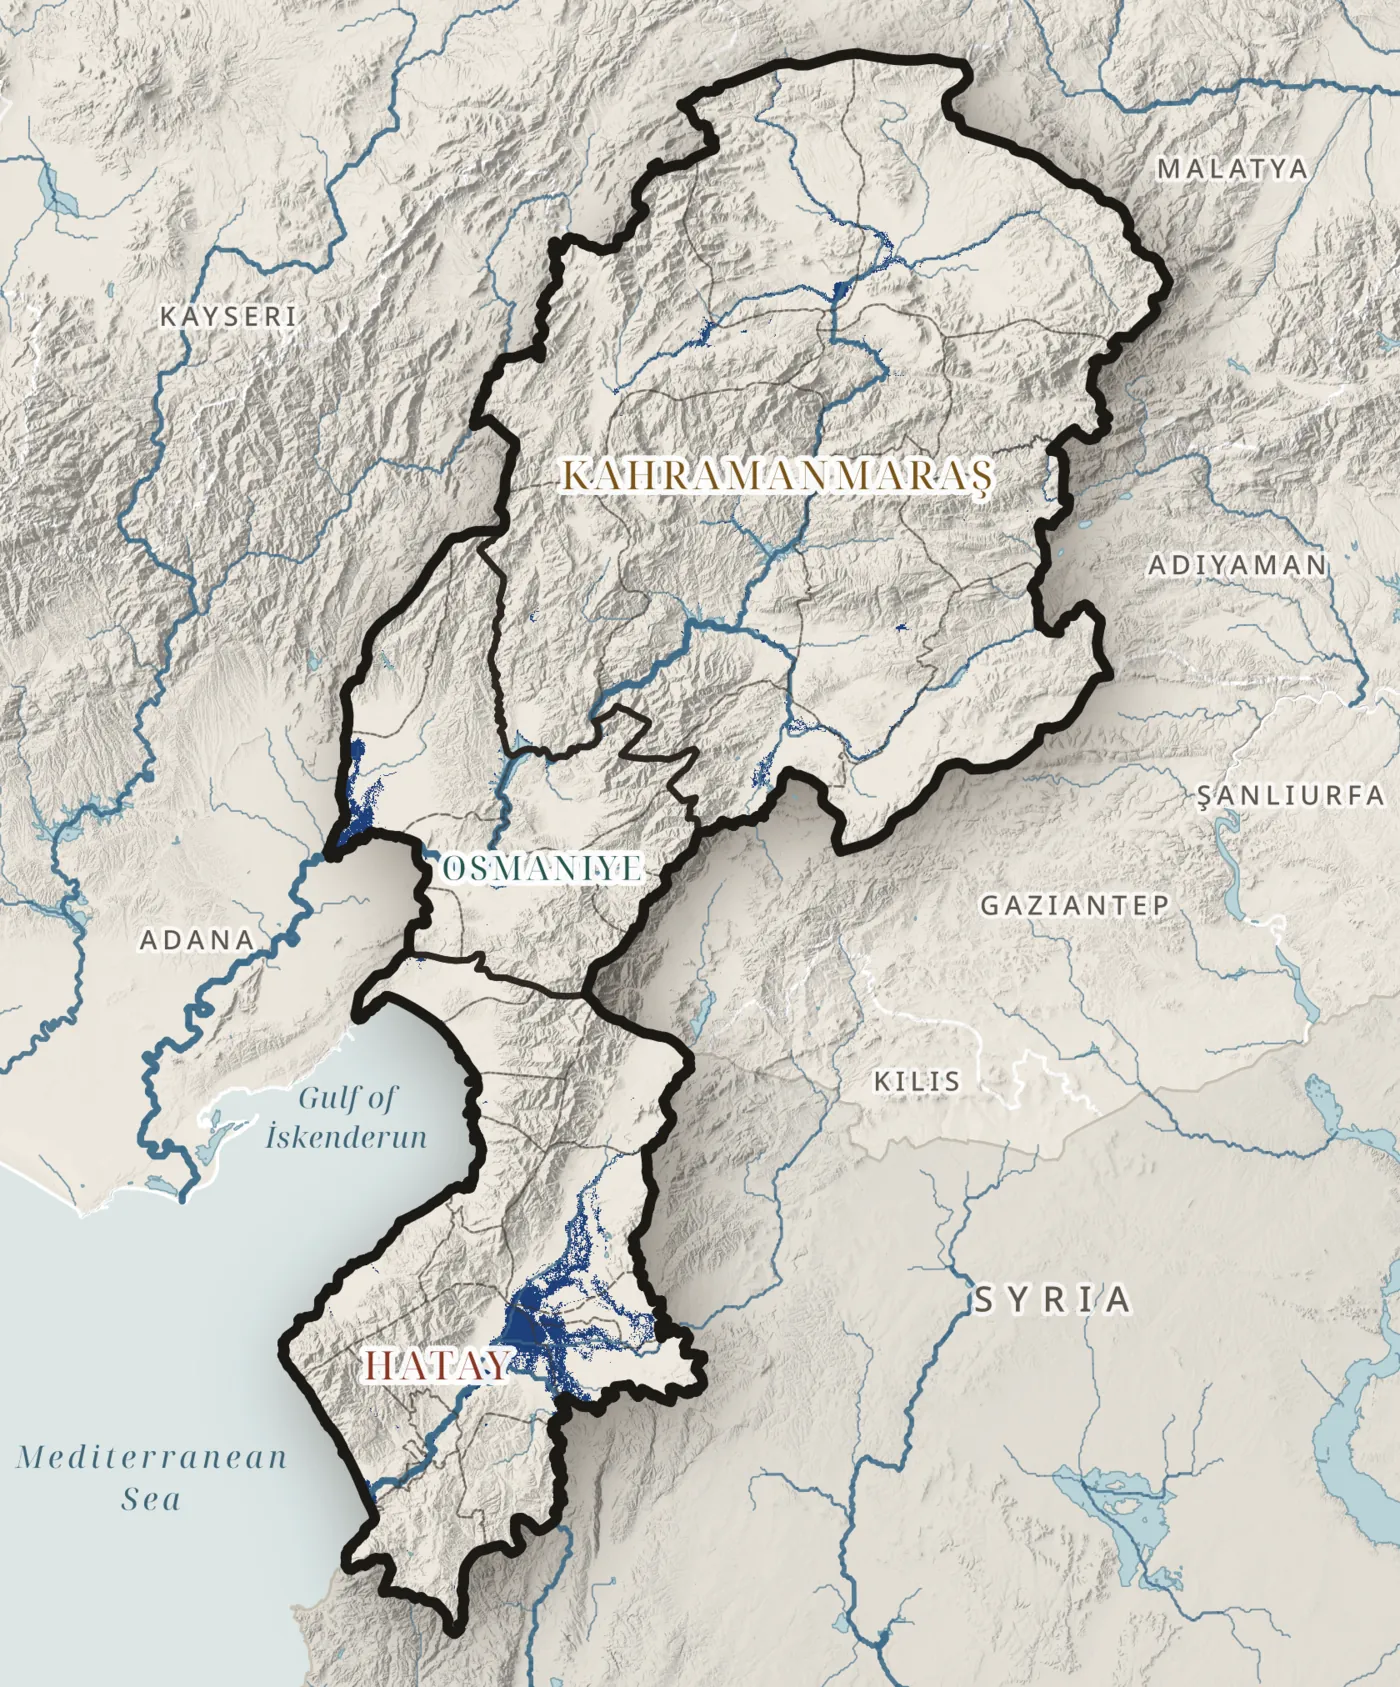
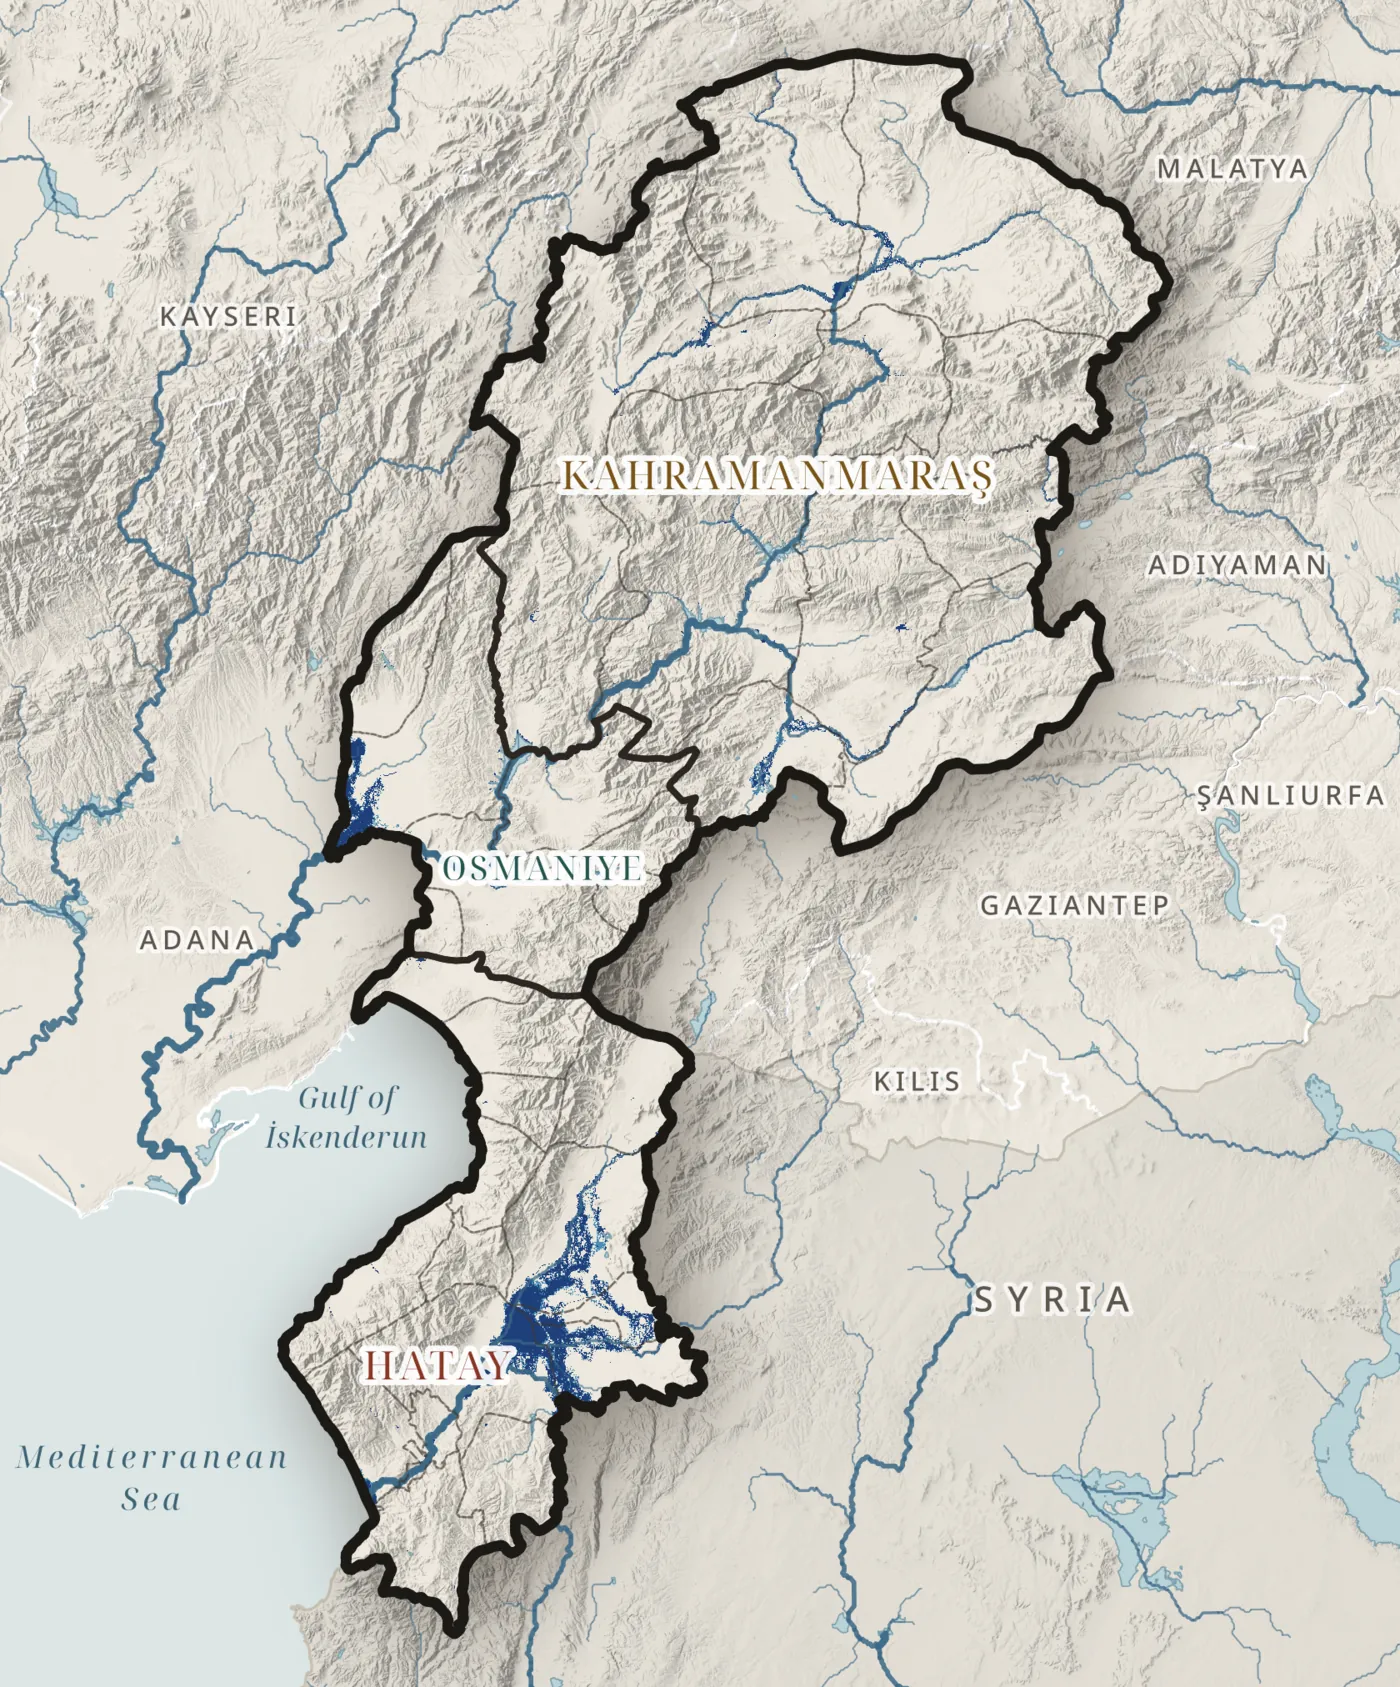
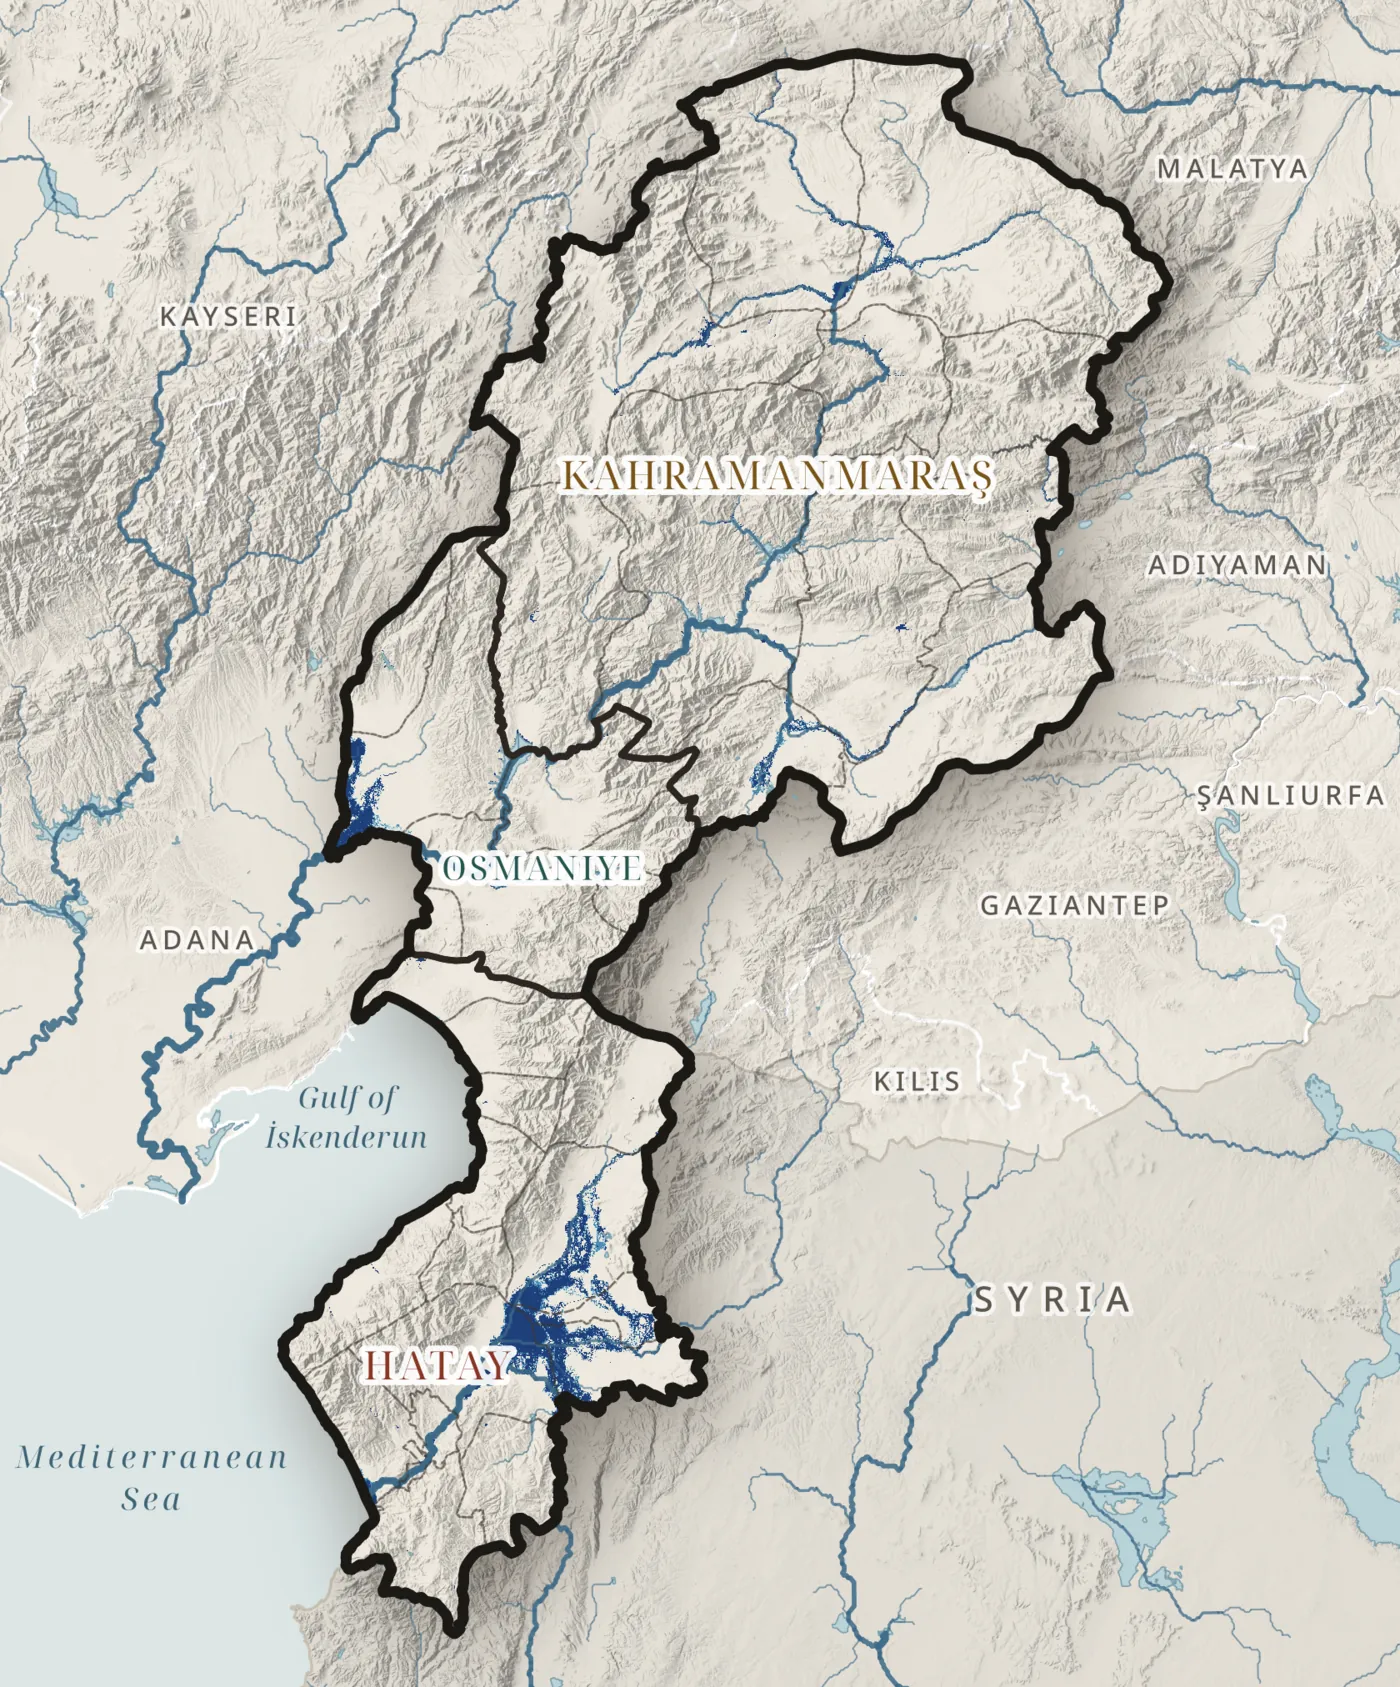
Flood frequency
The same land floods again and again
0km² · 10-year flood
JRC Global River Flood Hazard Maps · return periods 10–500 years · Map R08 · ↑ ↓ change the return period
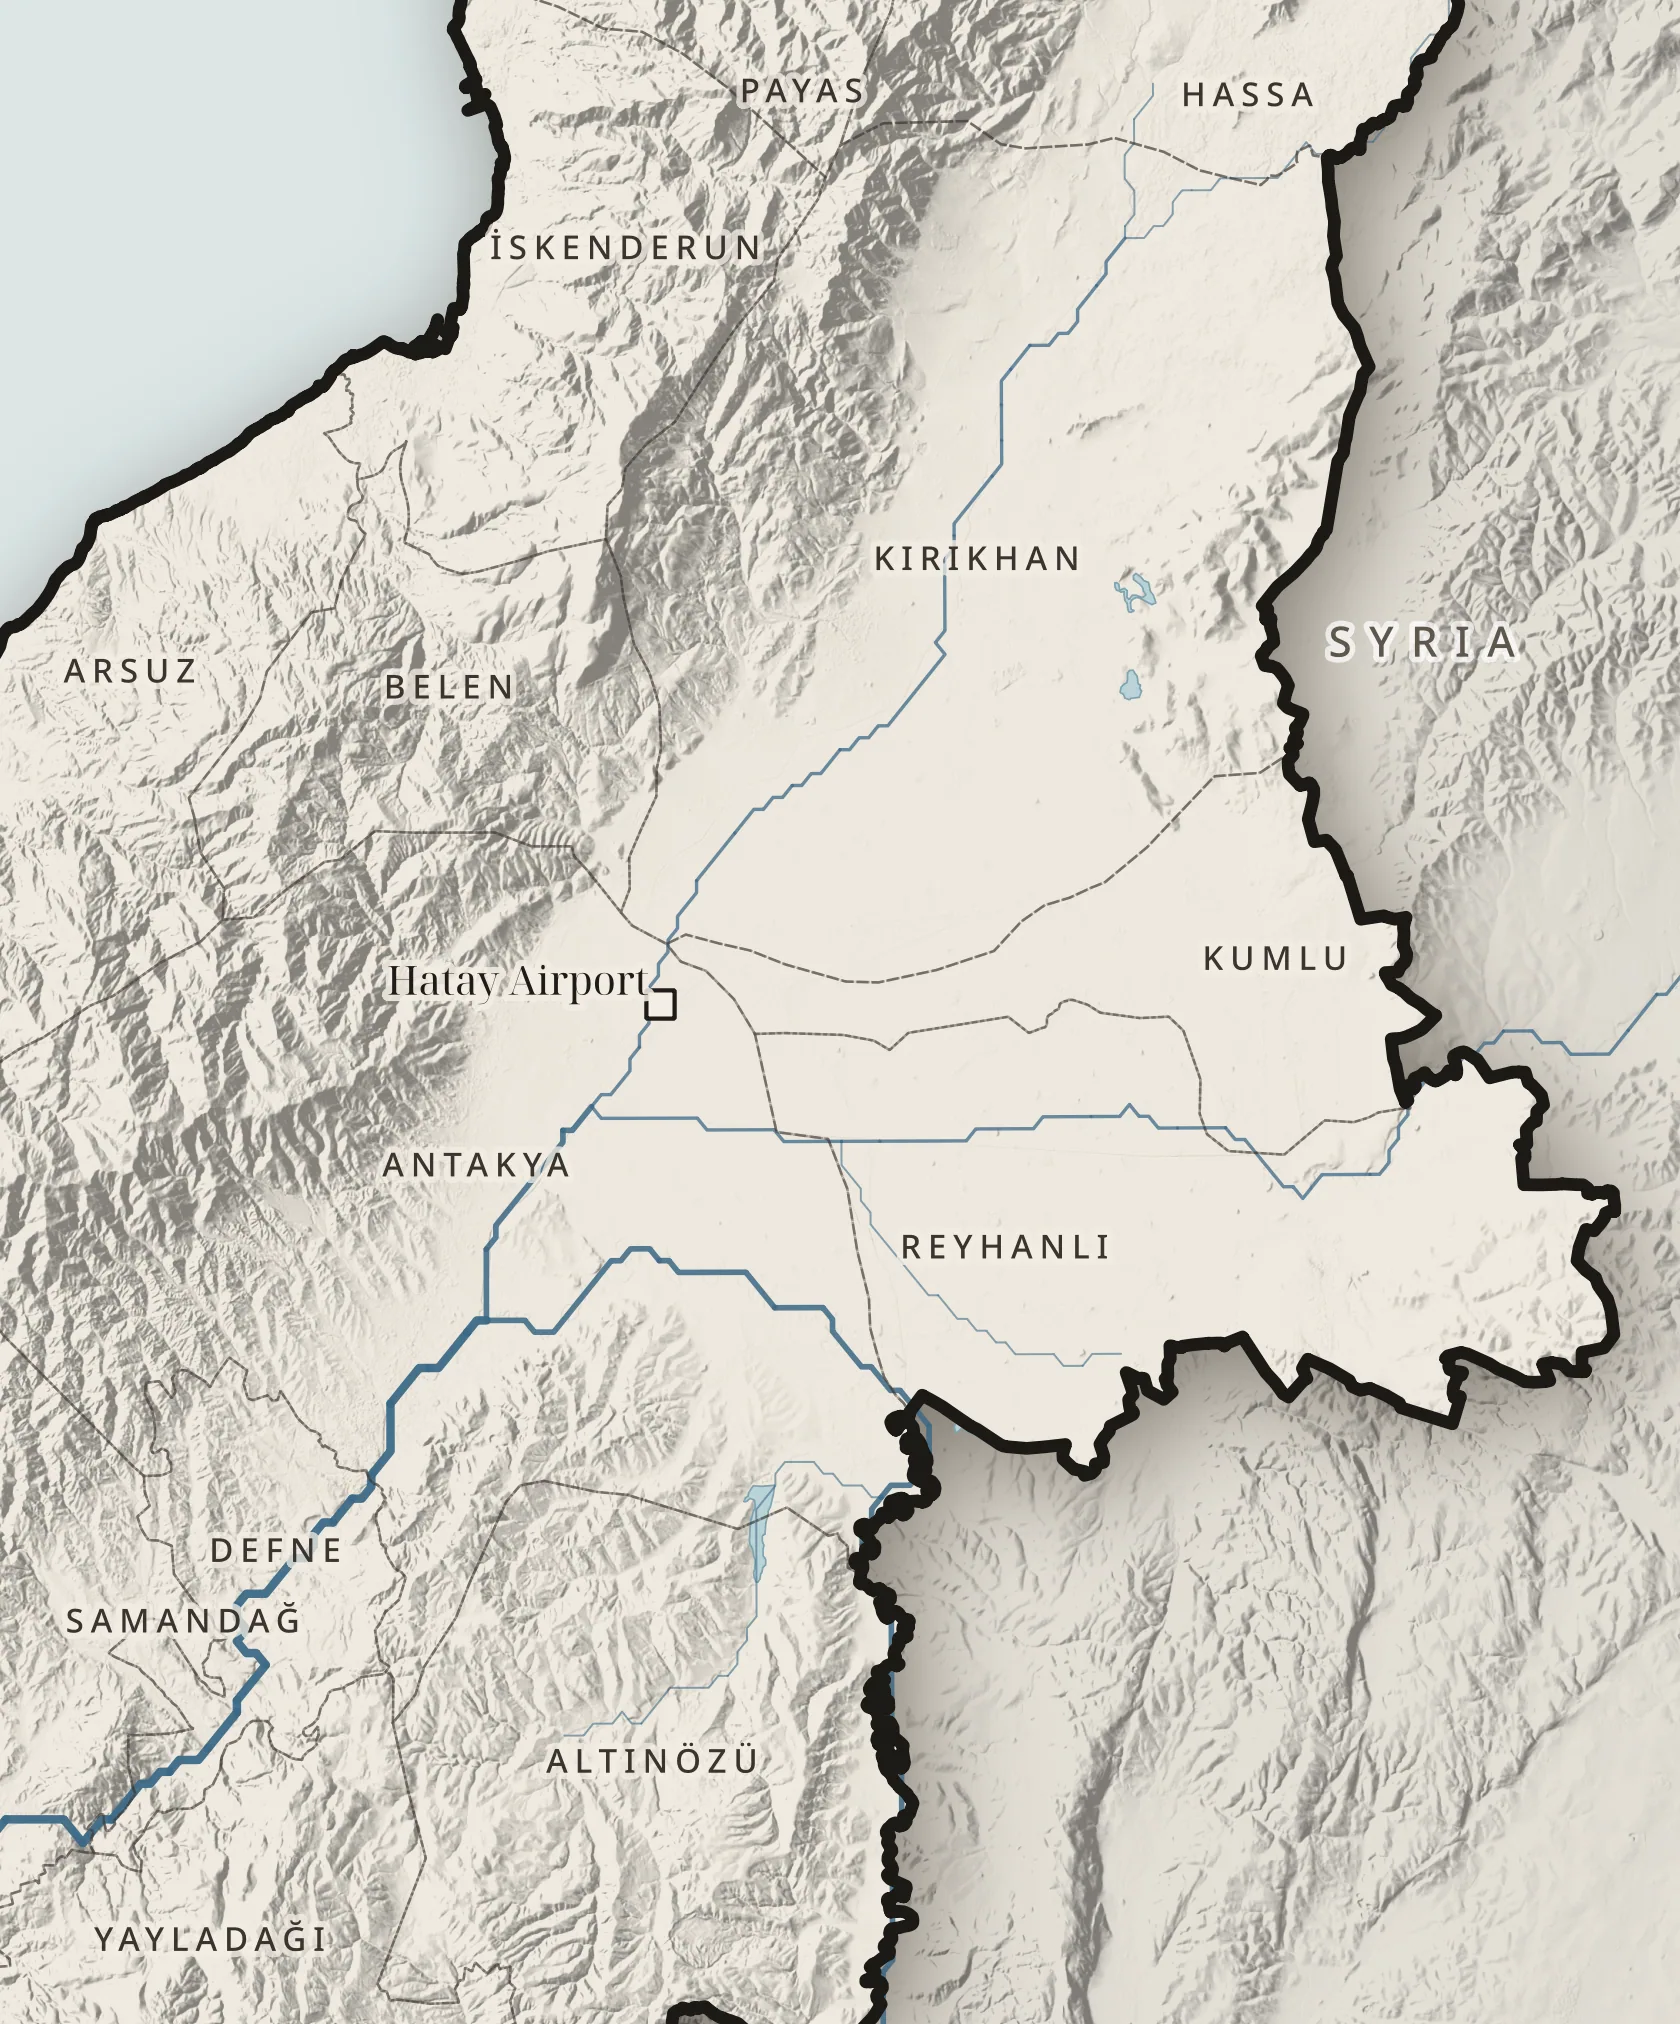
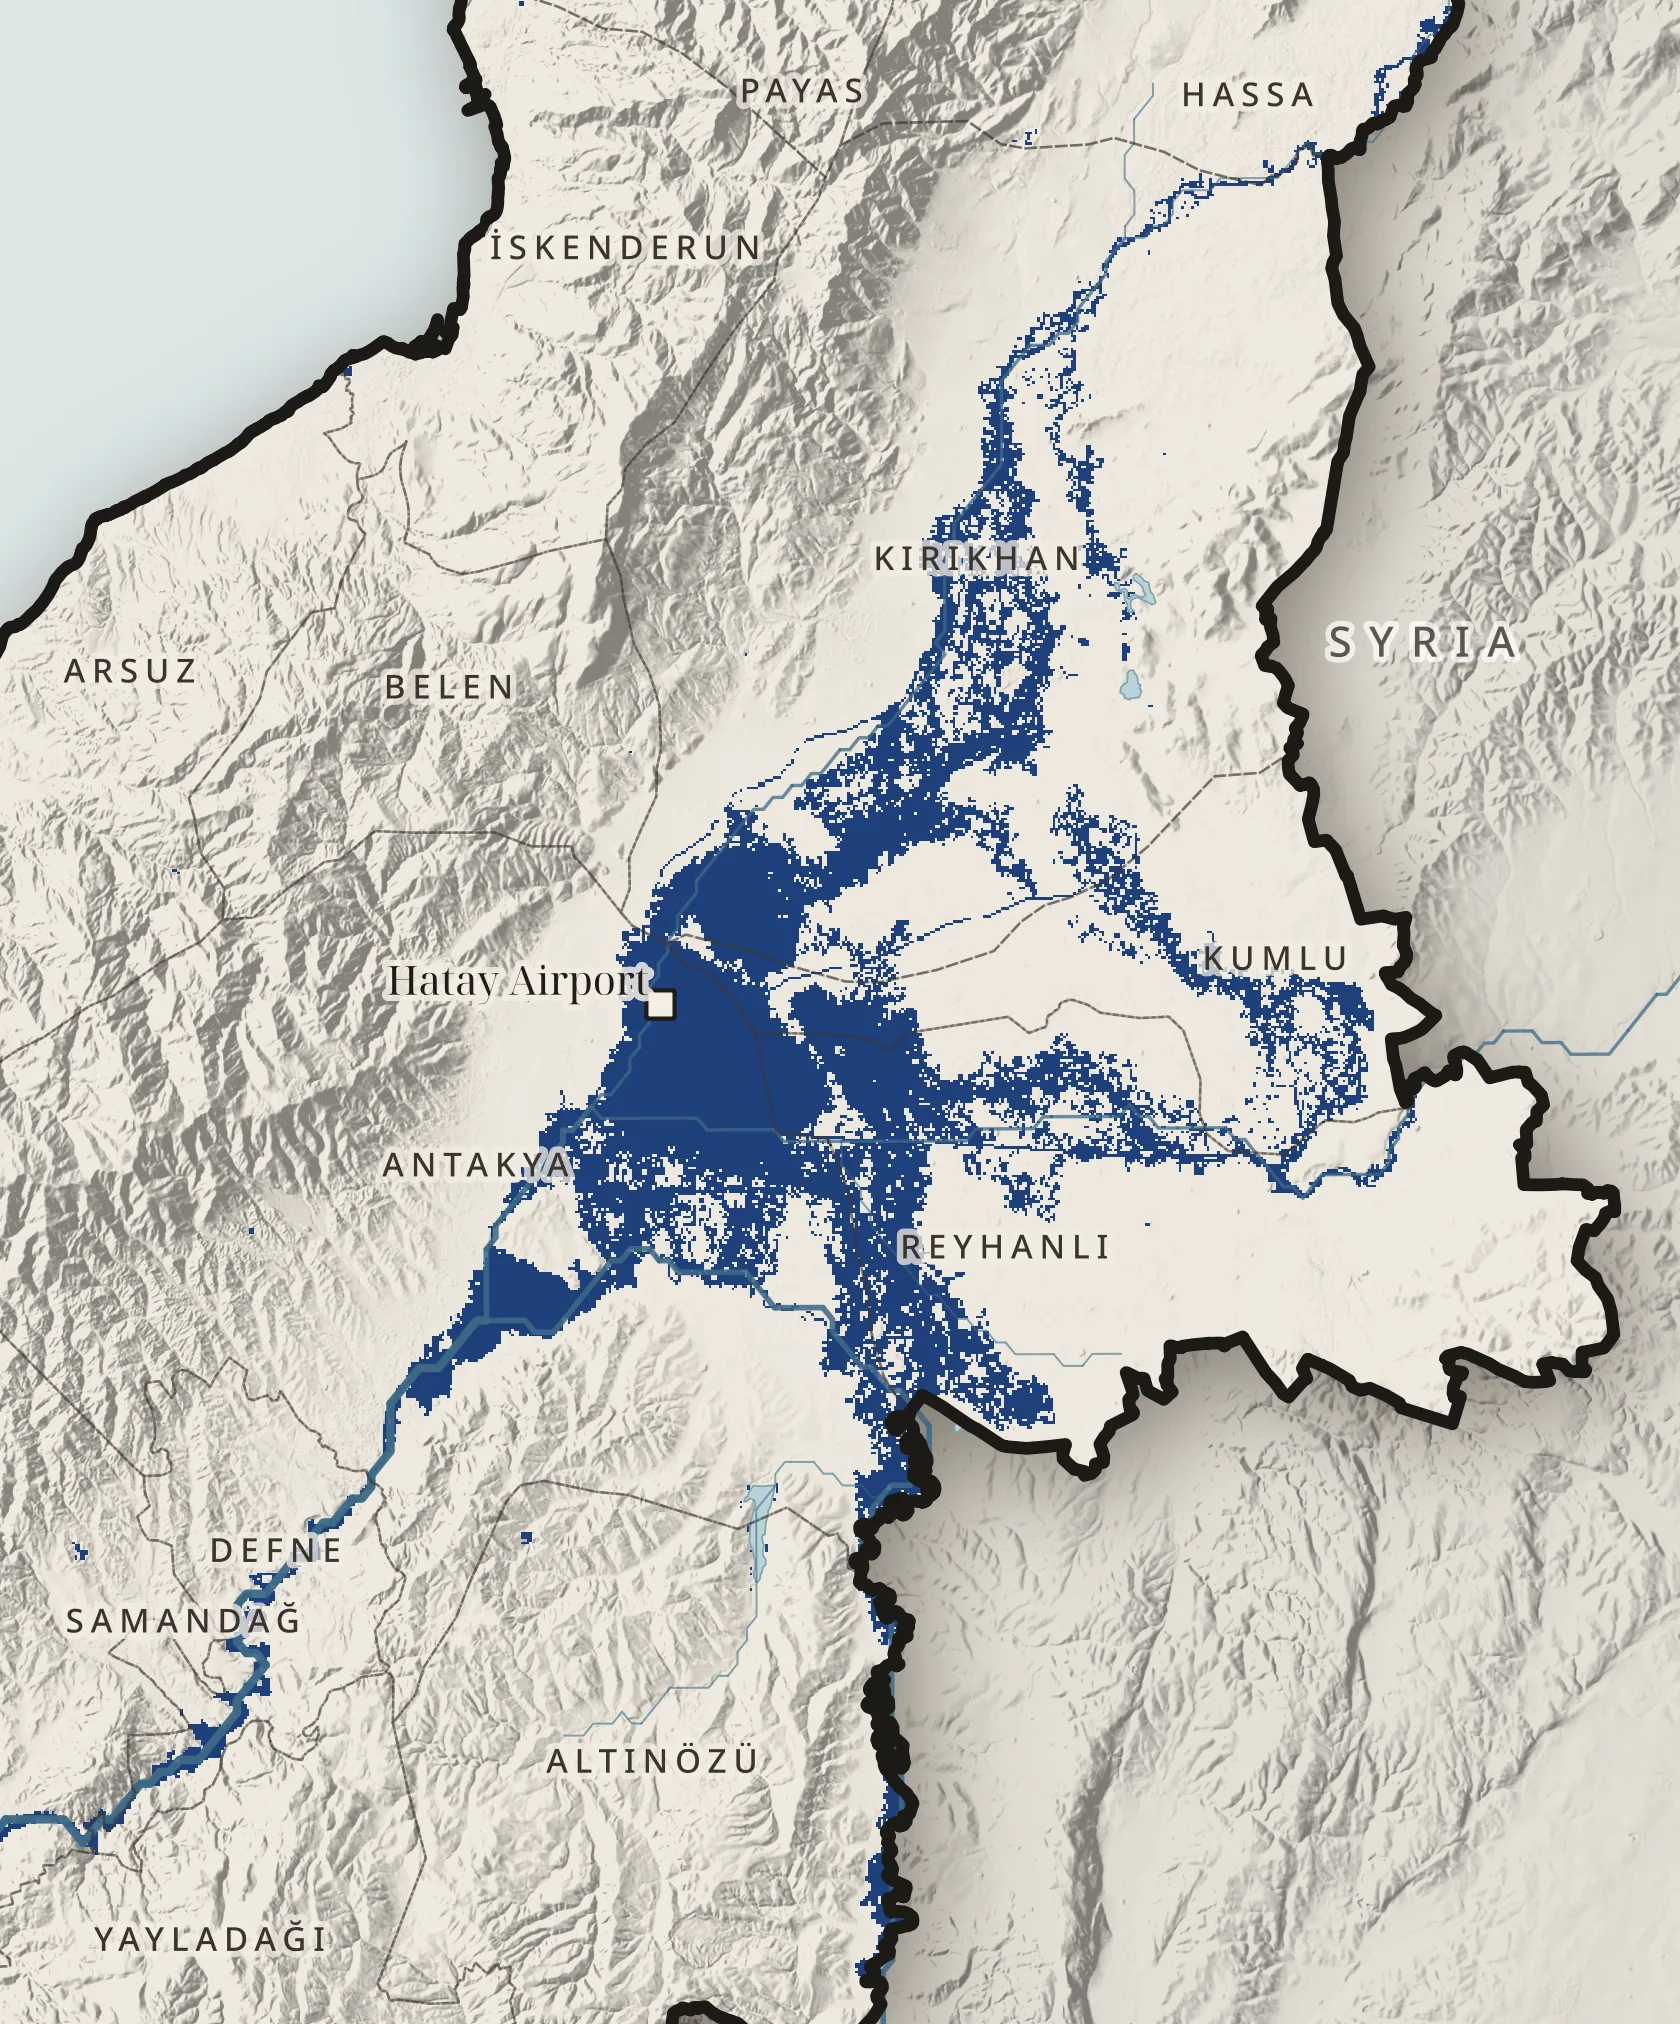
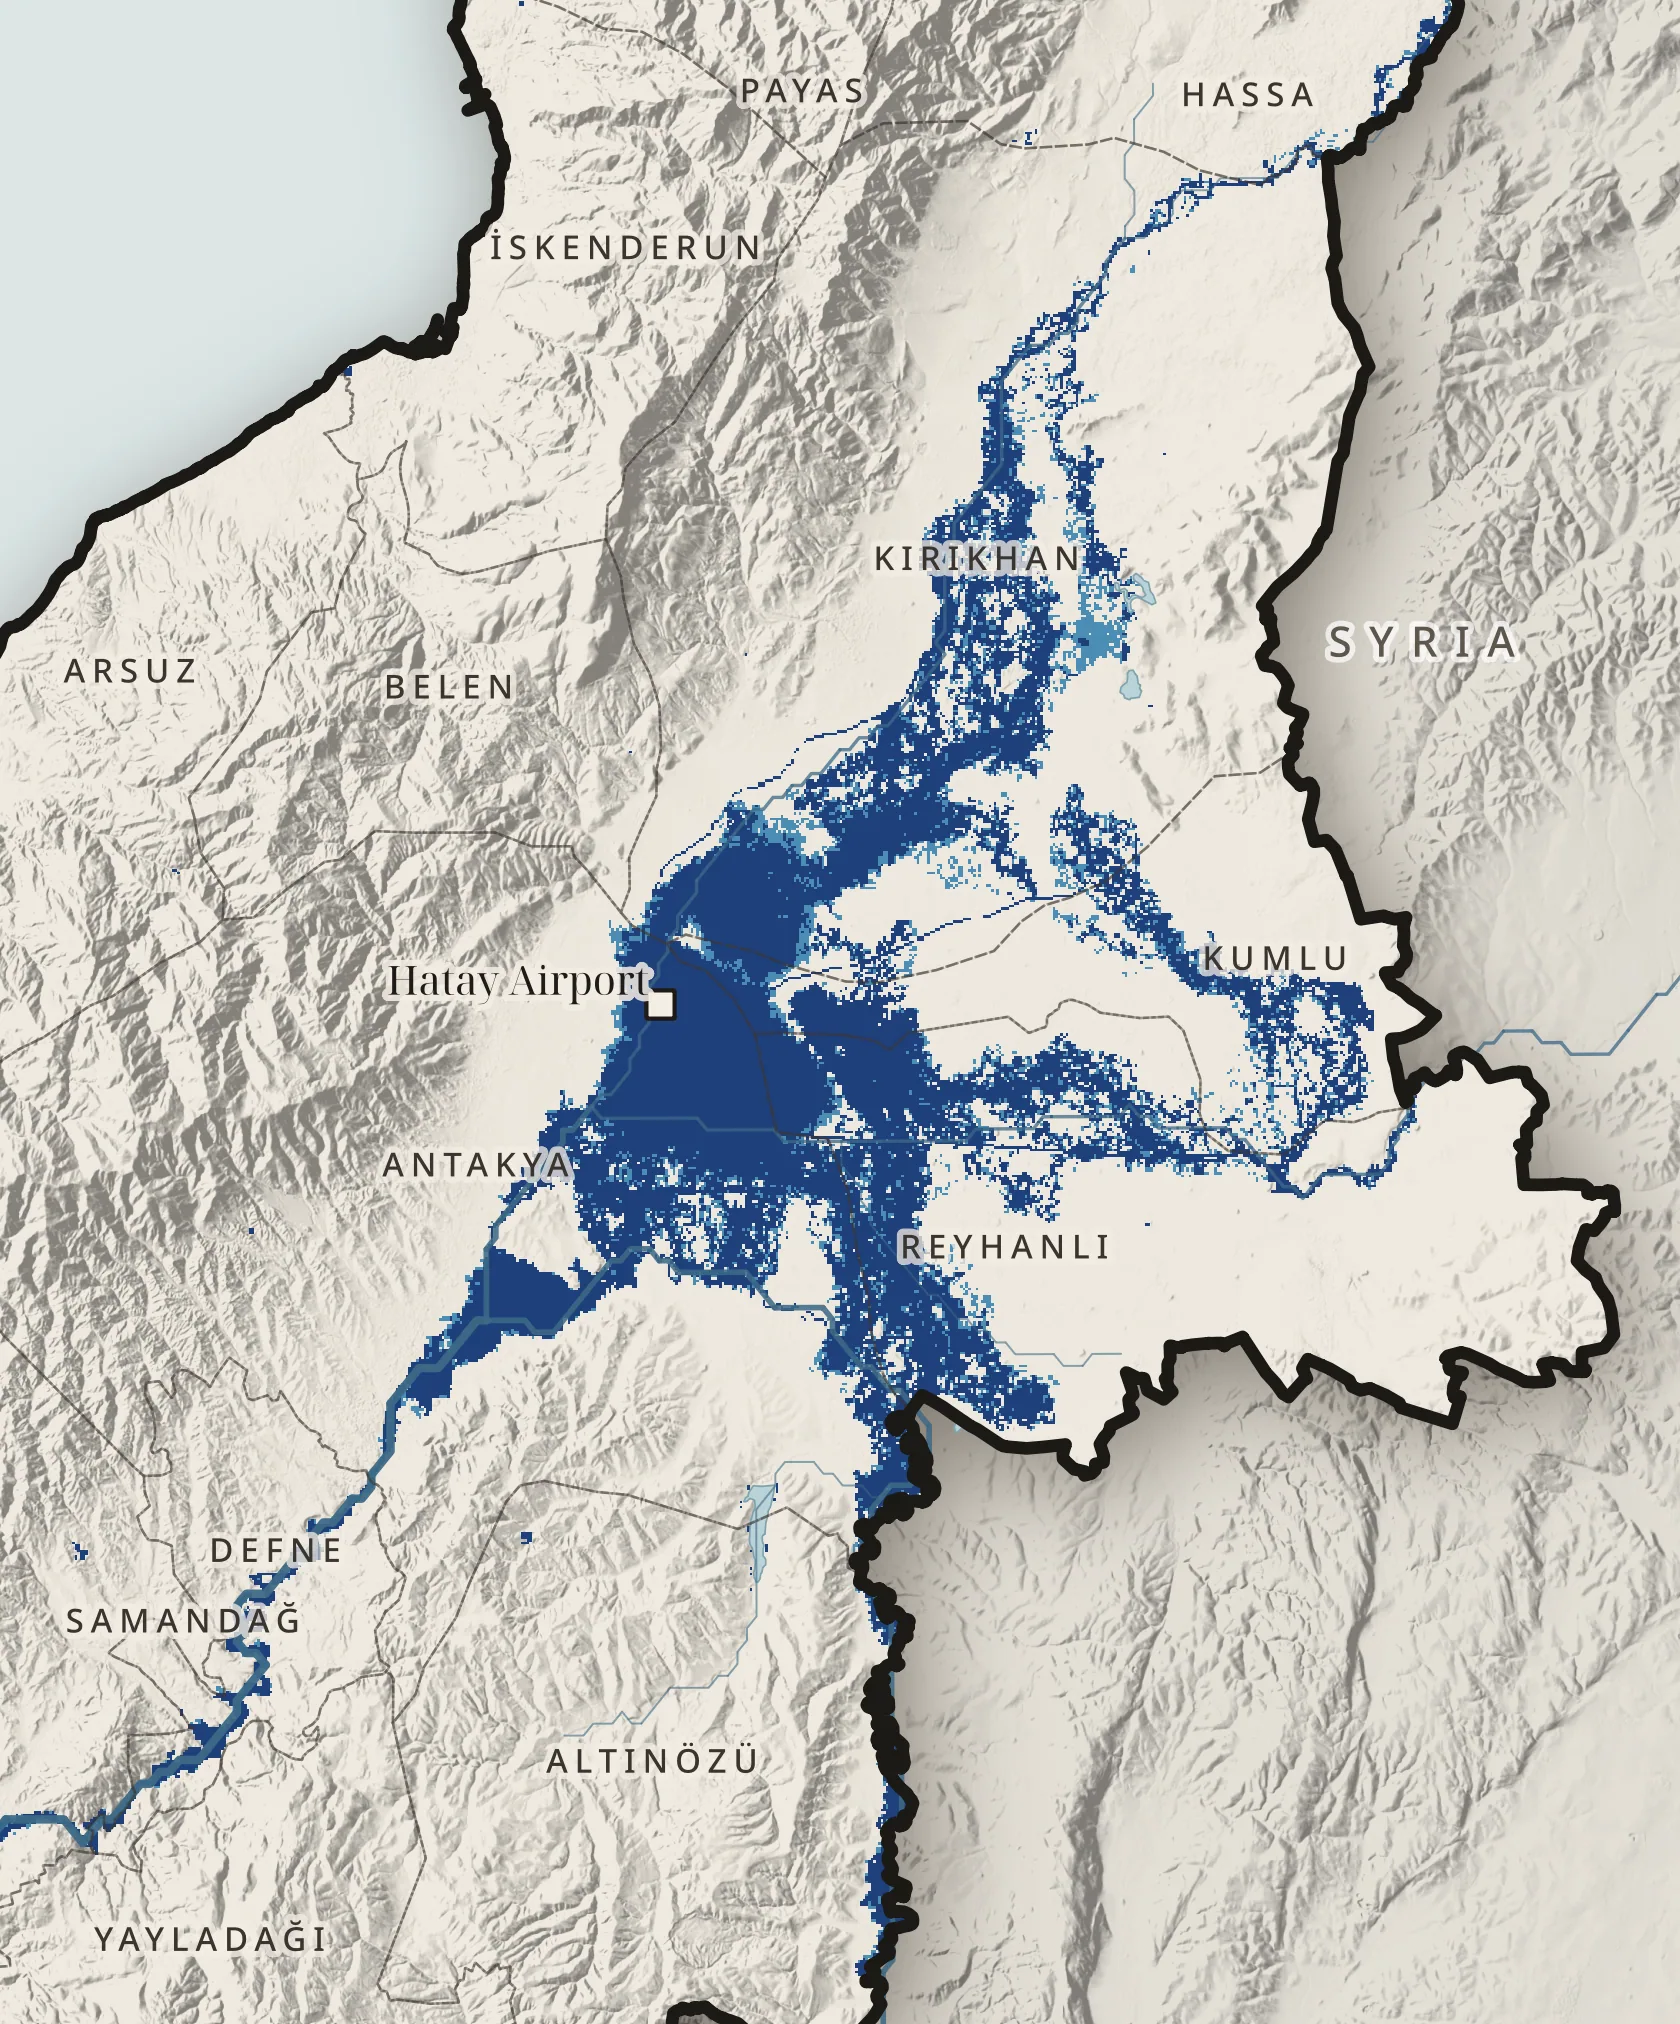
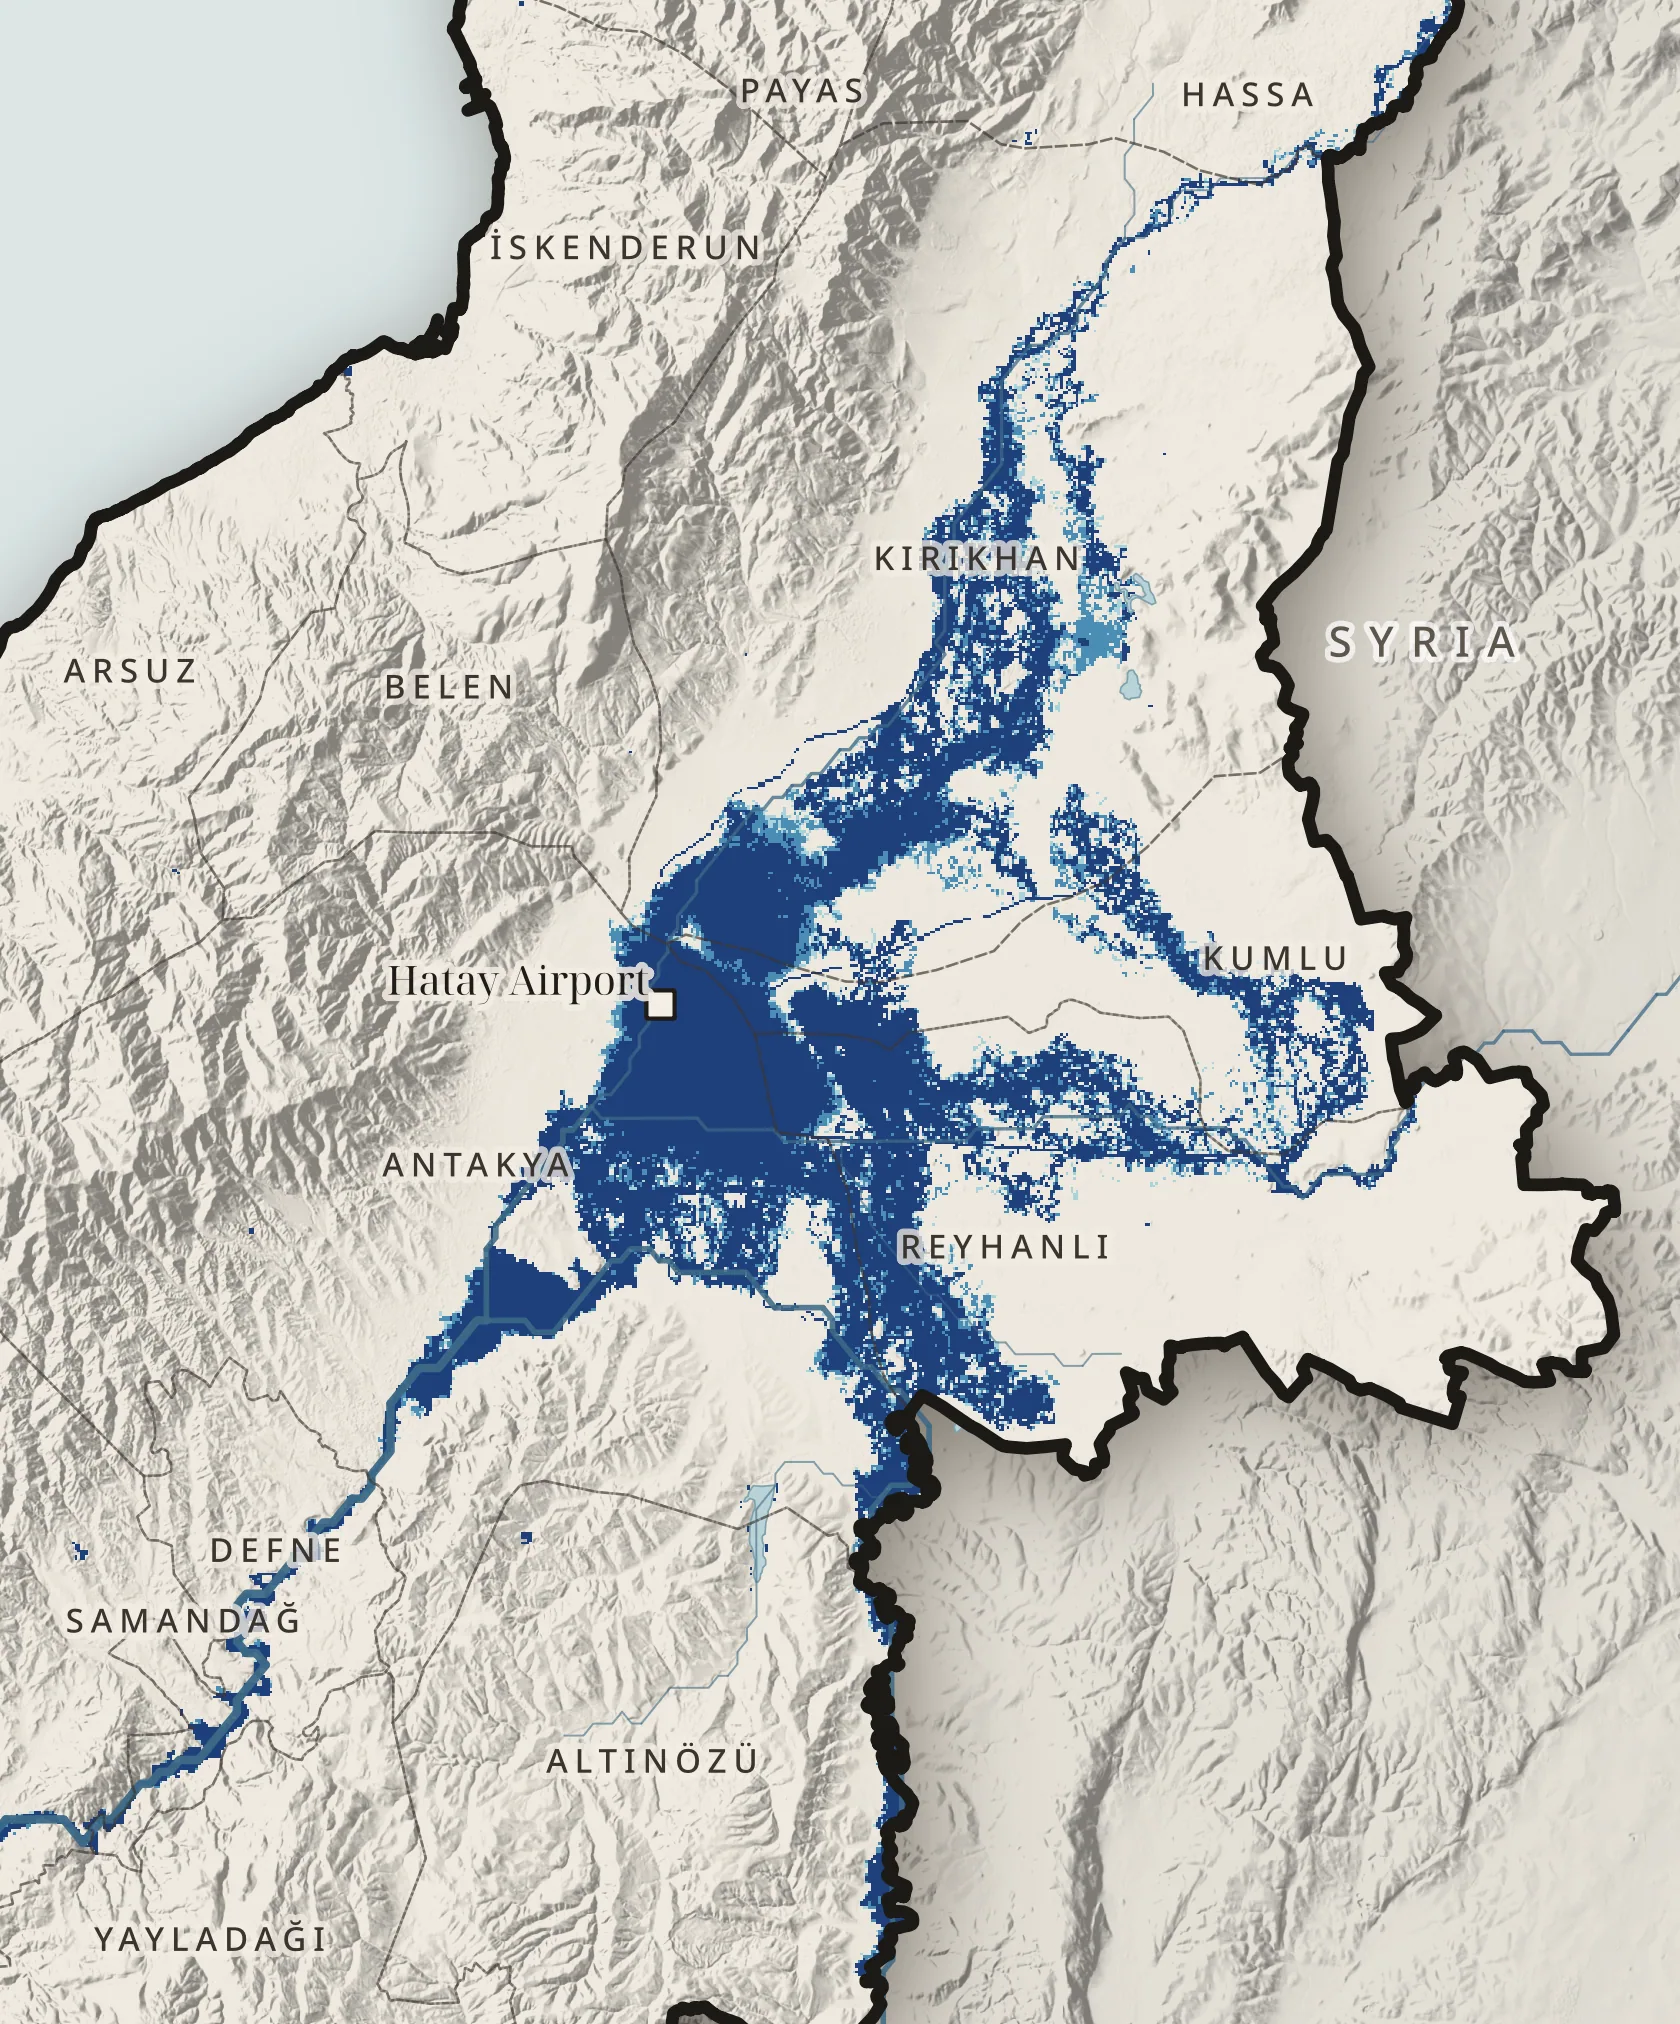
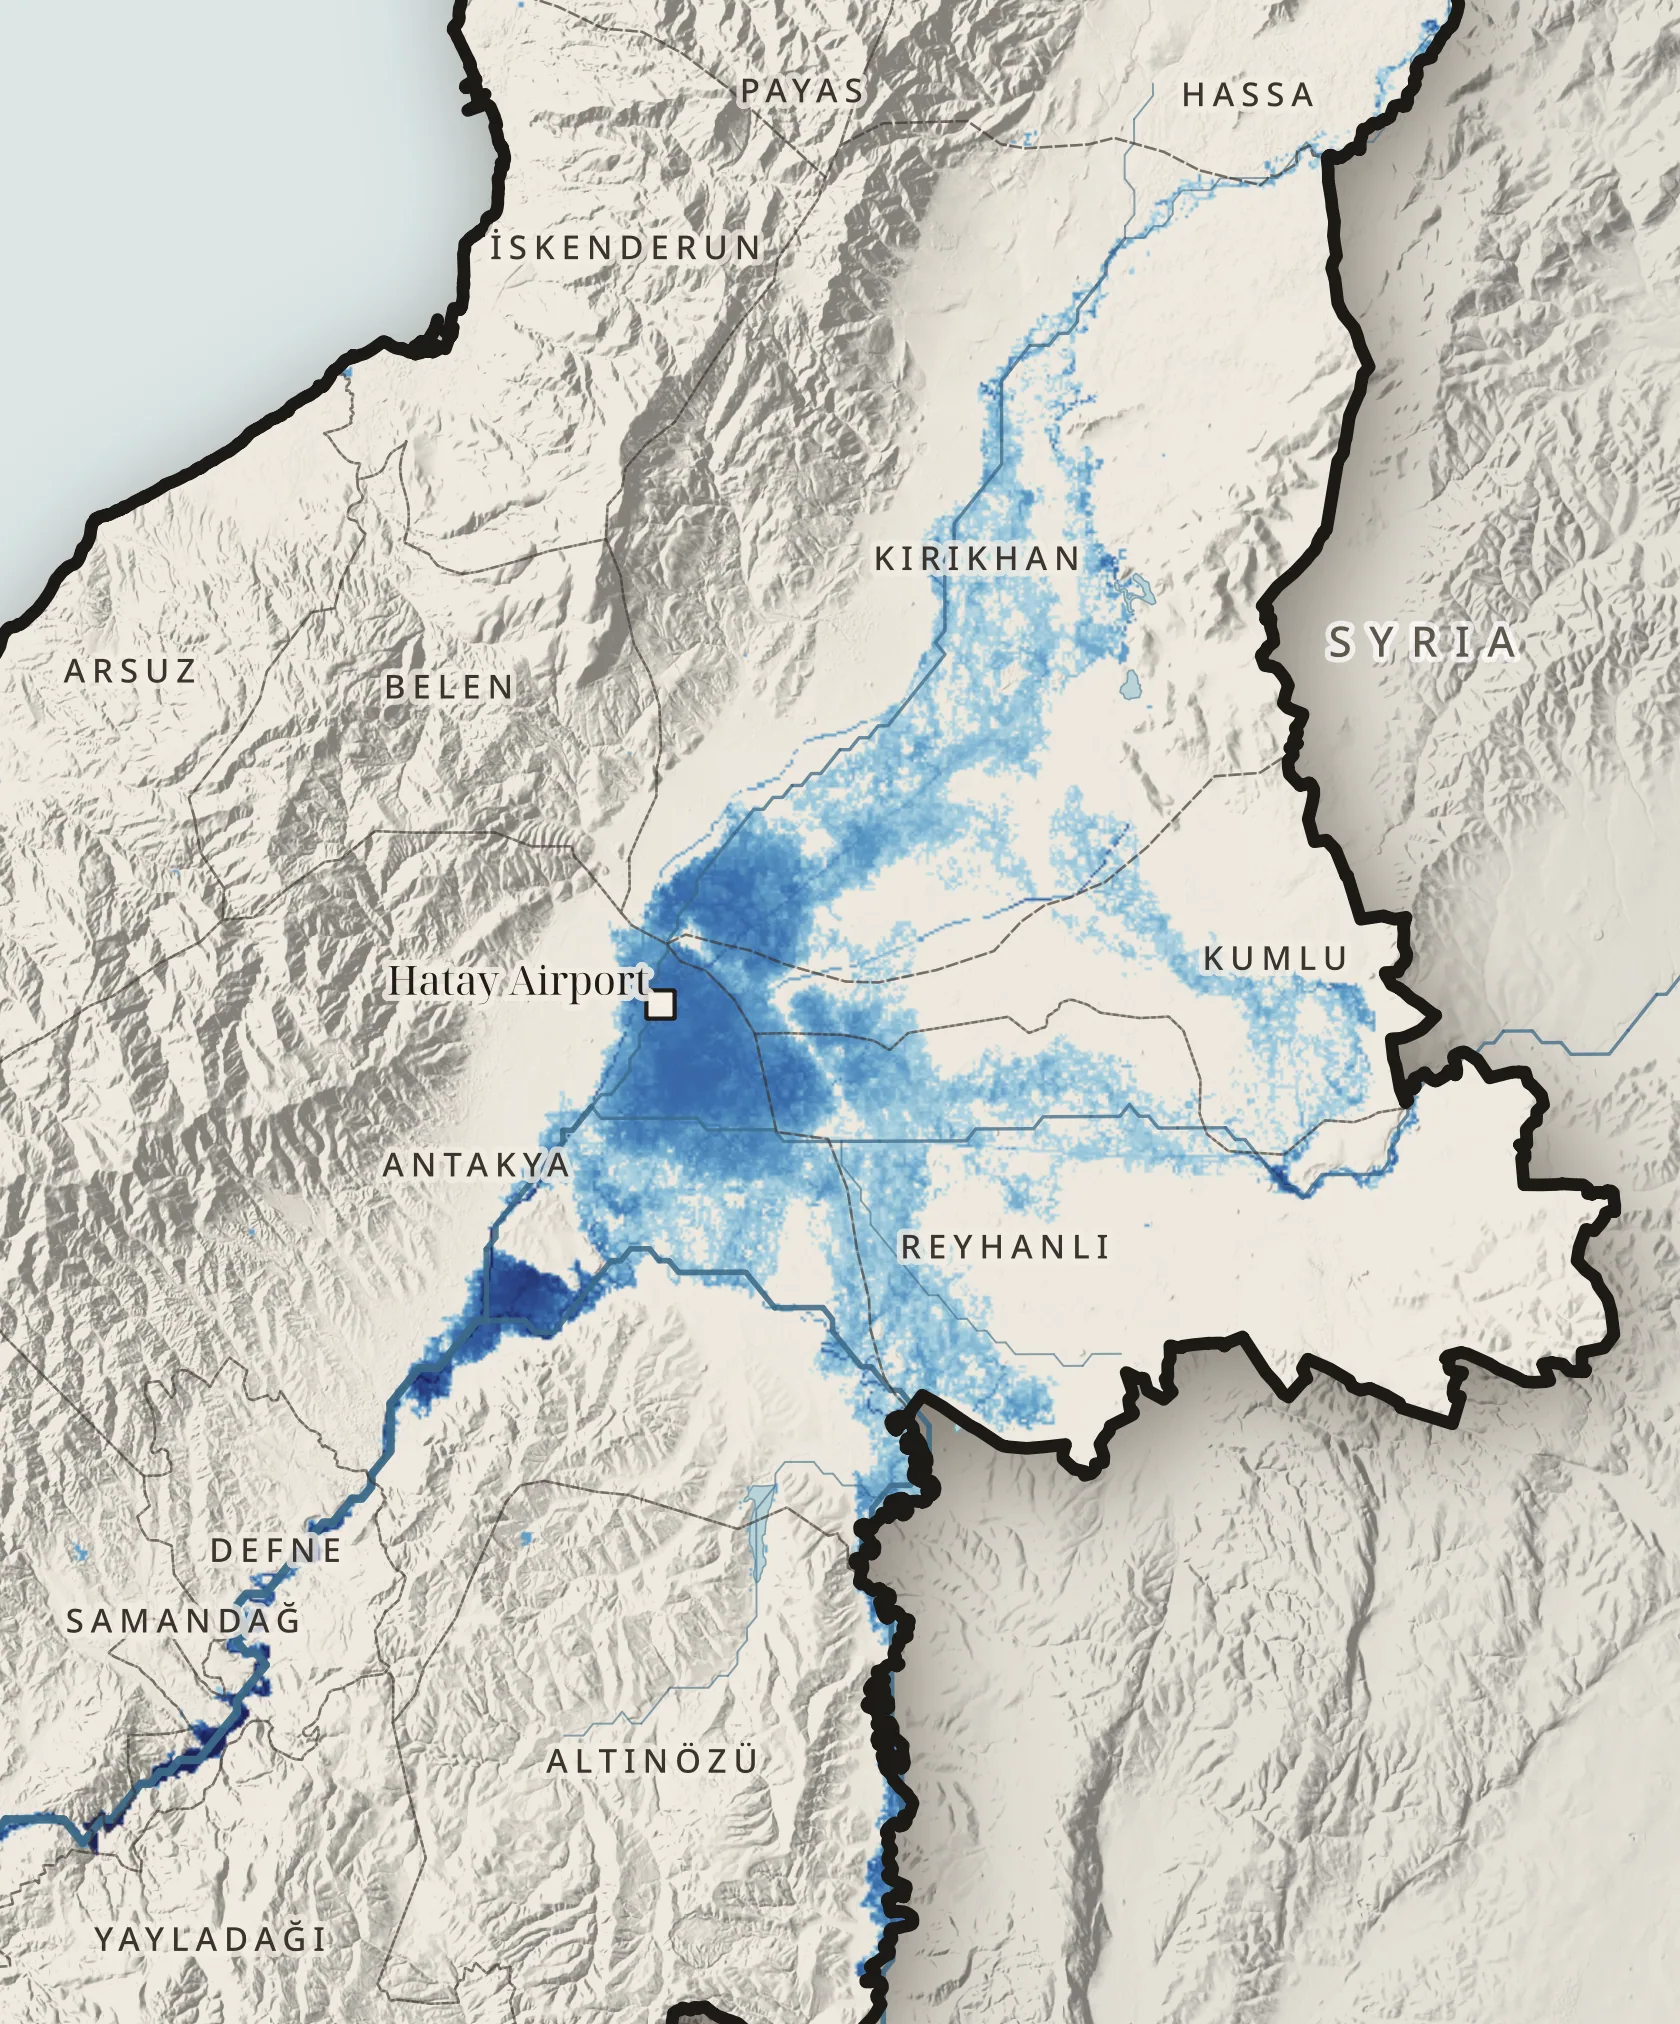
Amik Plain · zoom
The old lakebed fills again
0km² · 10-year flood
JRC Global River Flood Hazard Maps · Antakya, Kırıkhan, Reyhanlı and Kumlu · Map R09 · ↑ ↓ change the return period
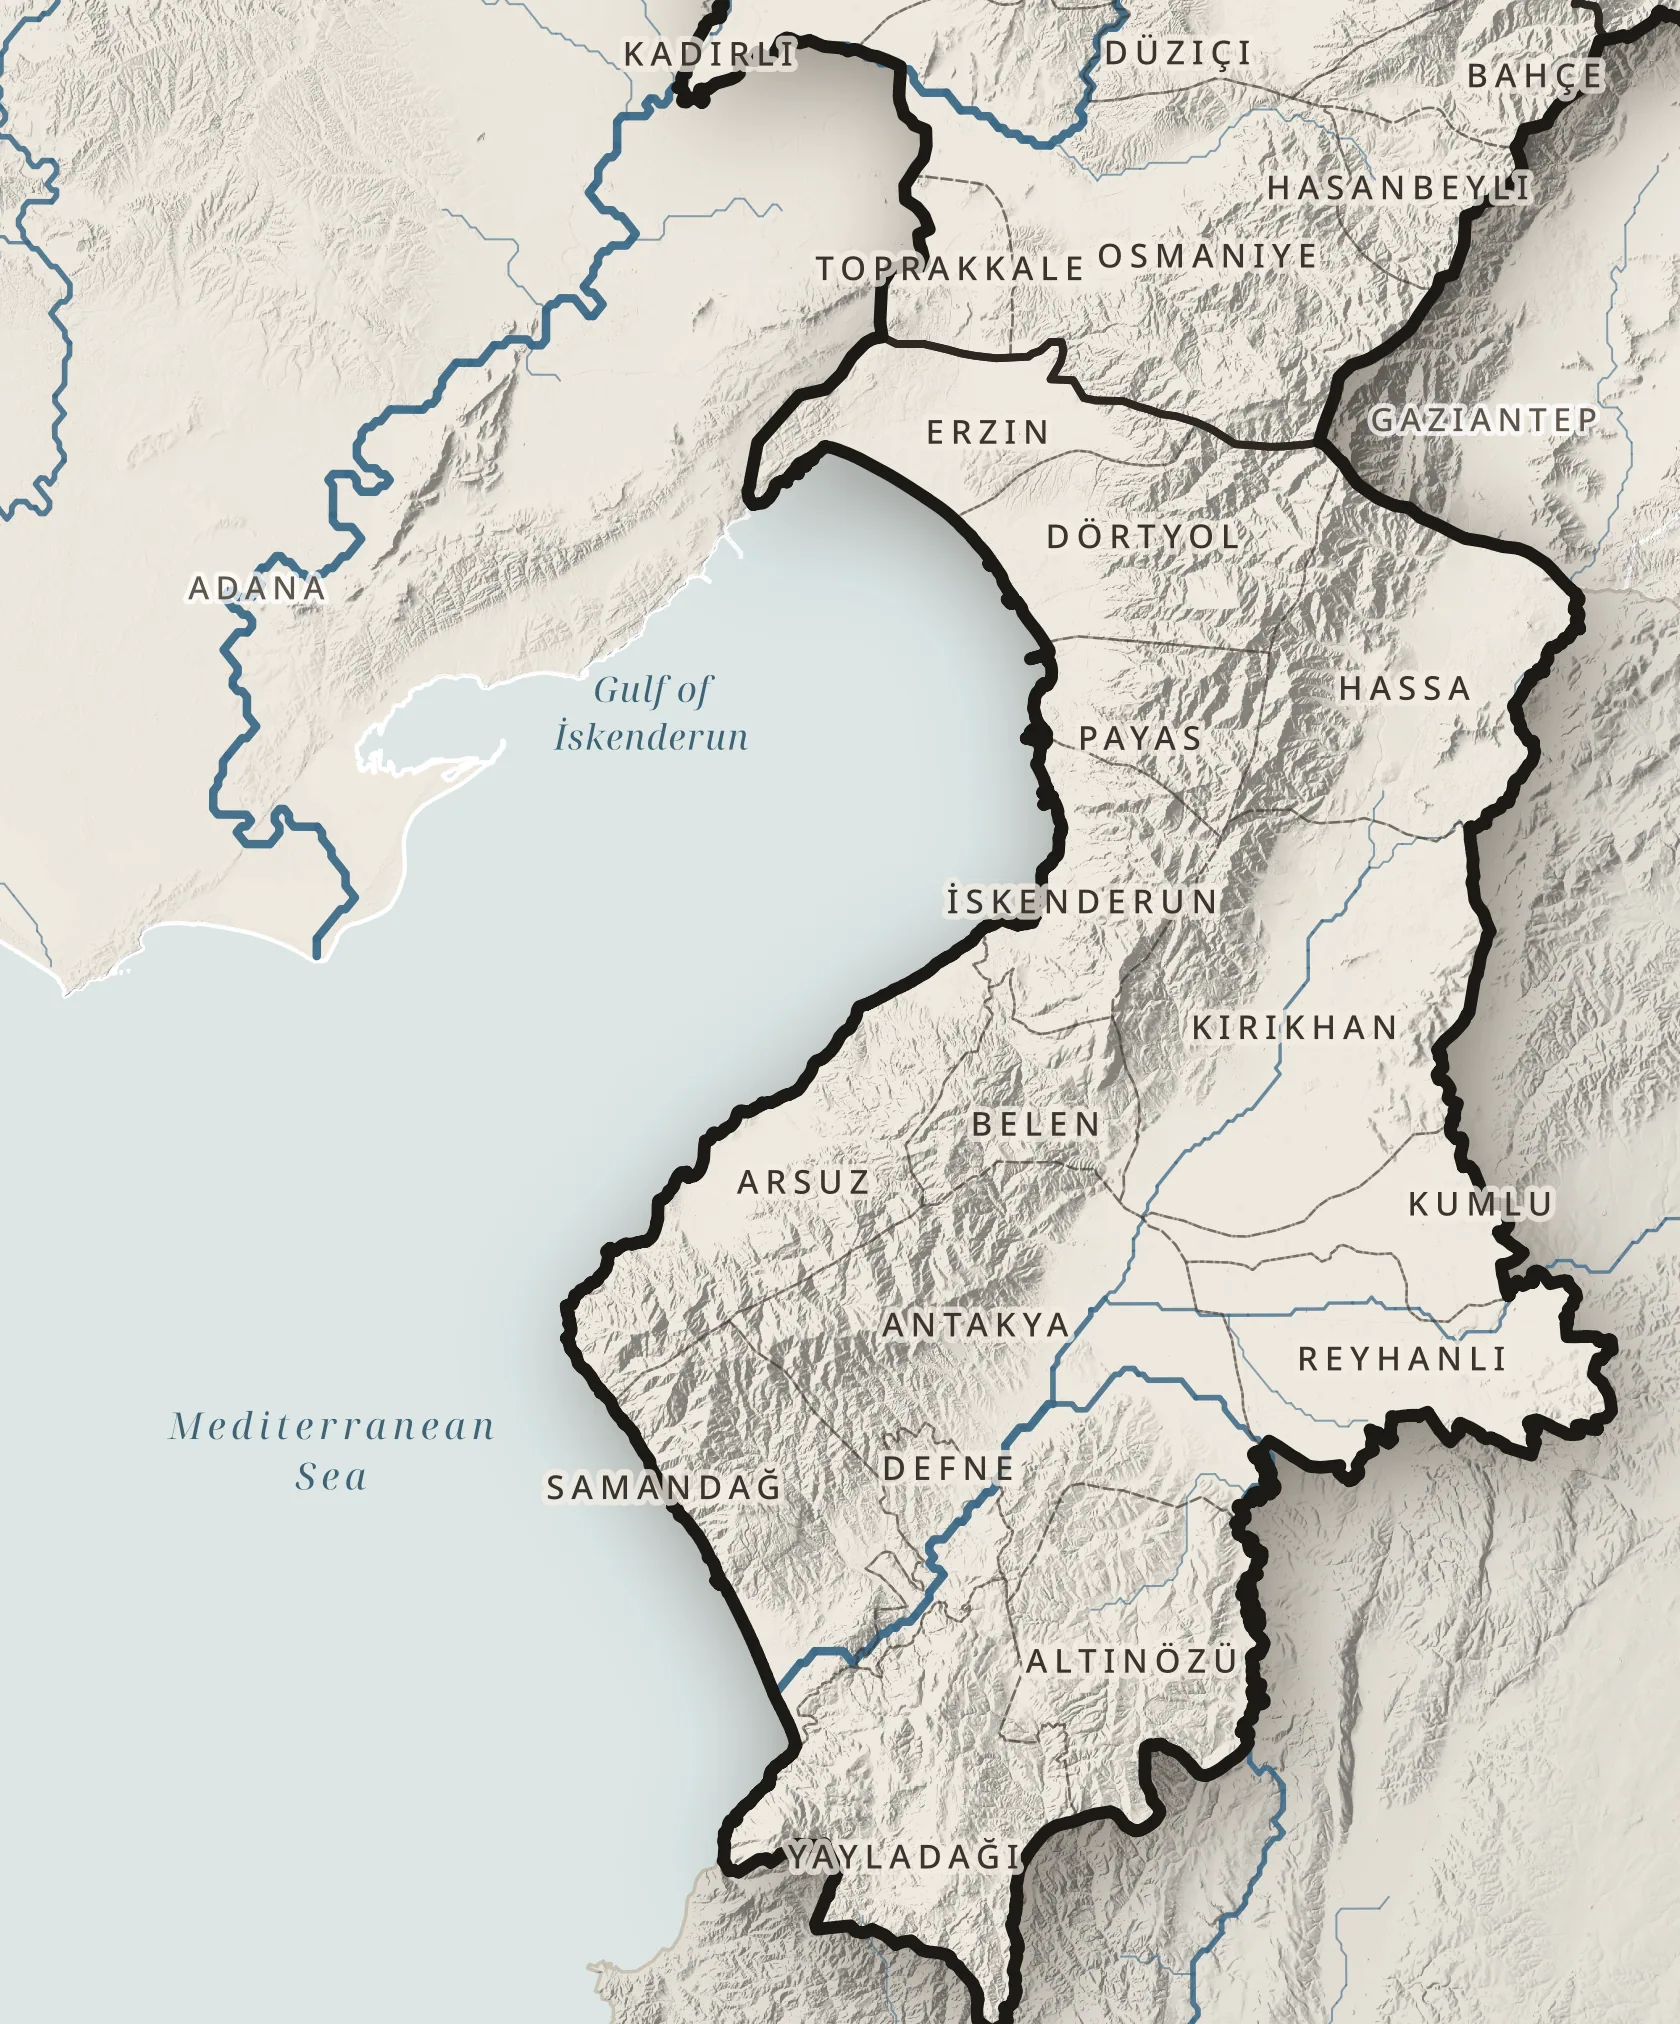
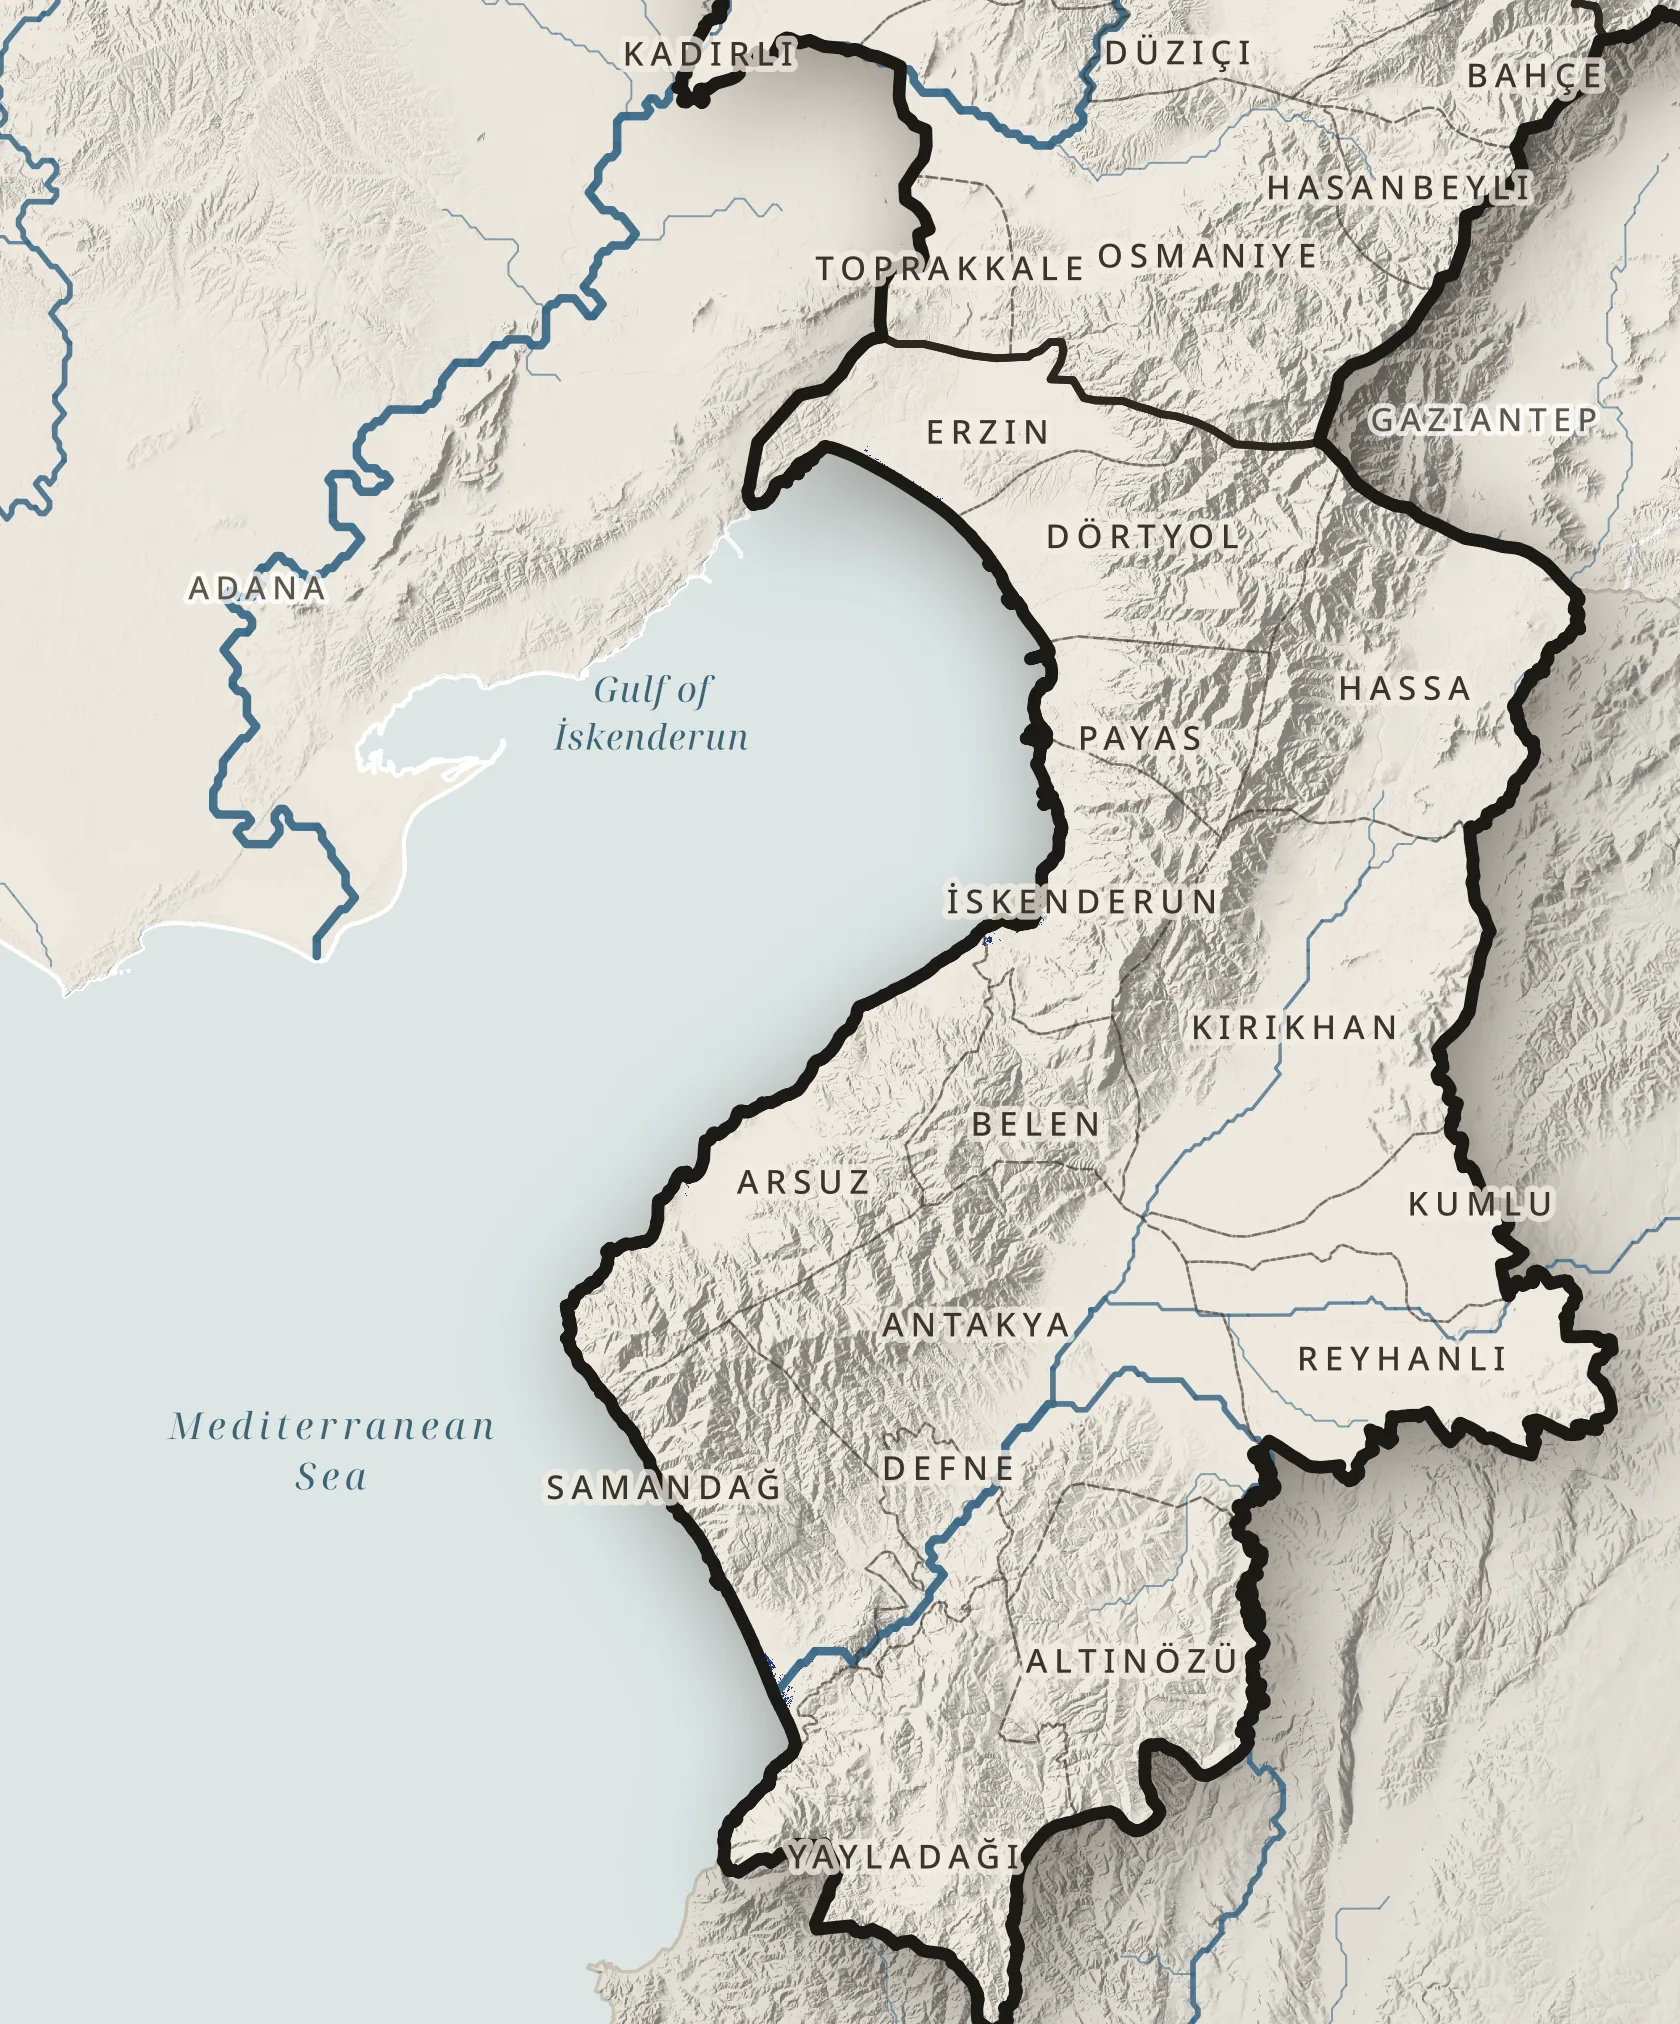
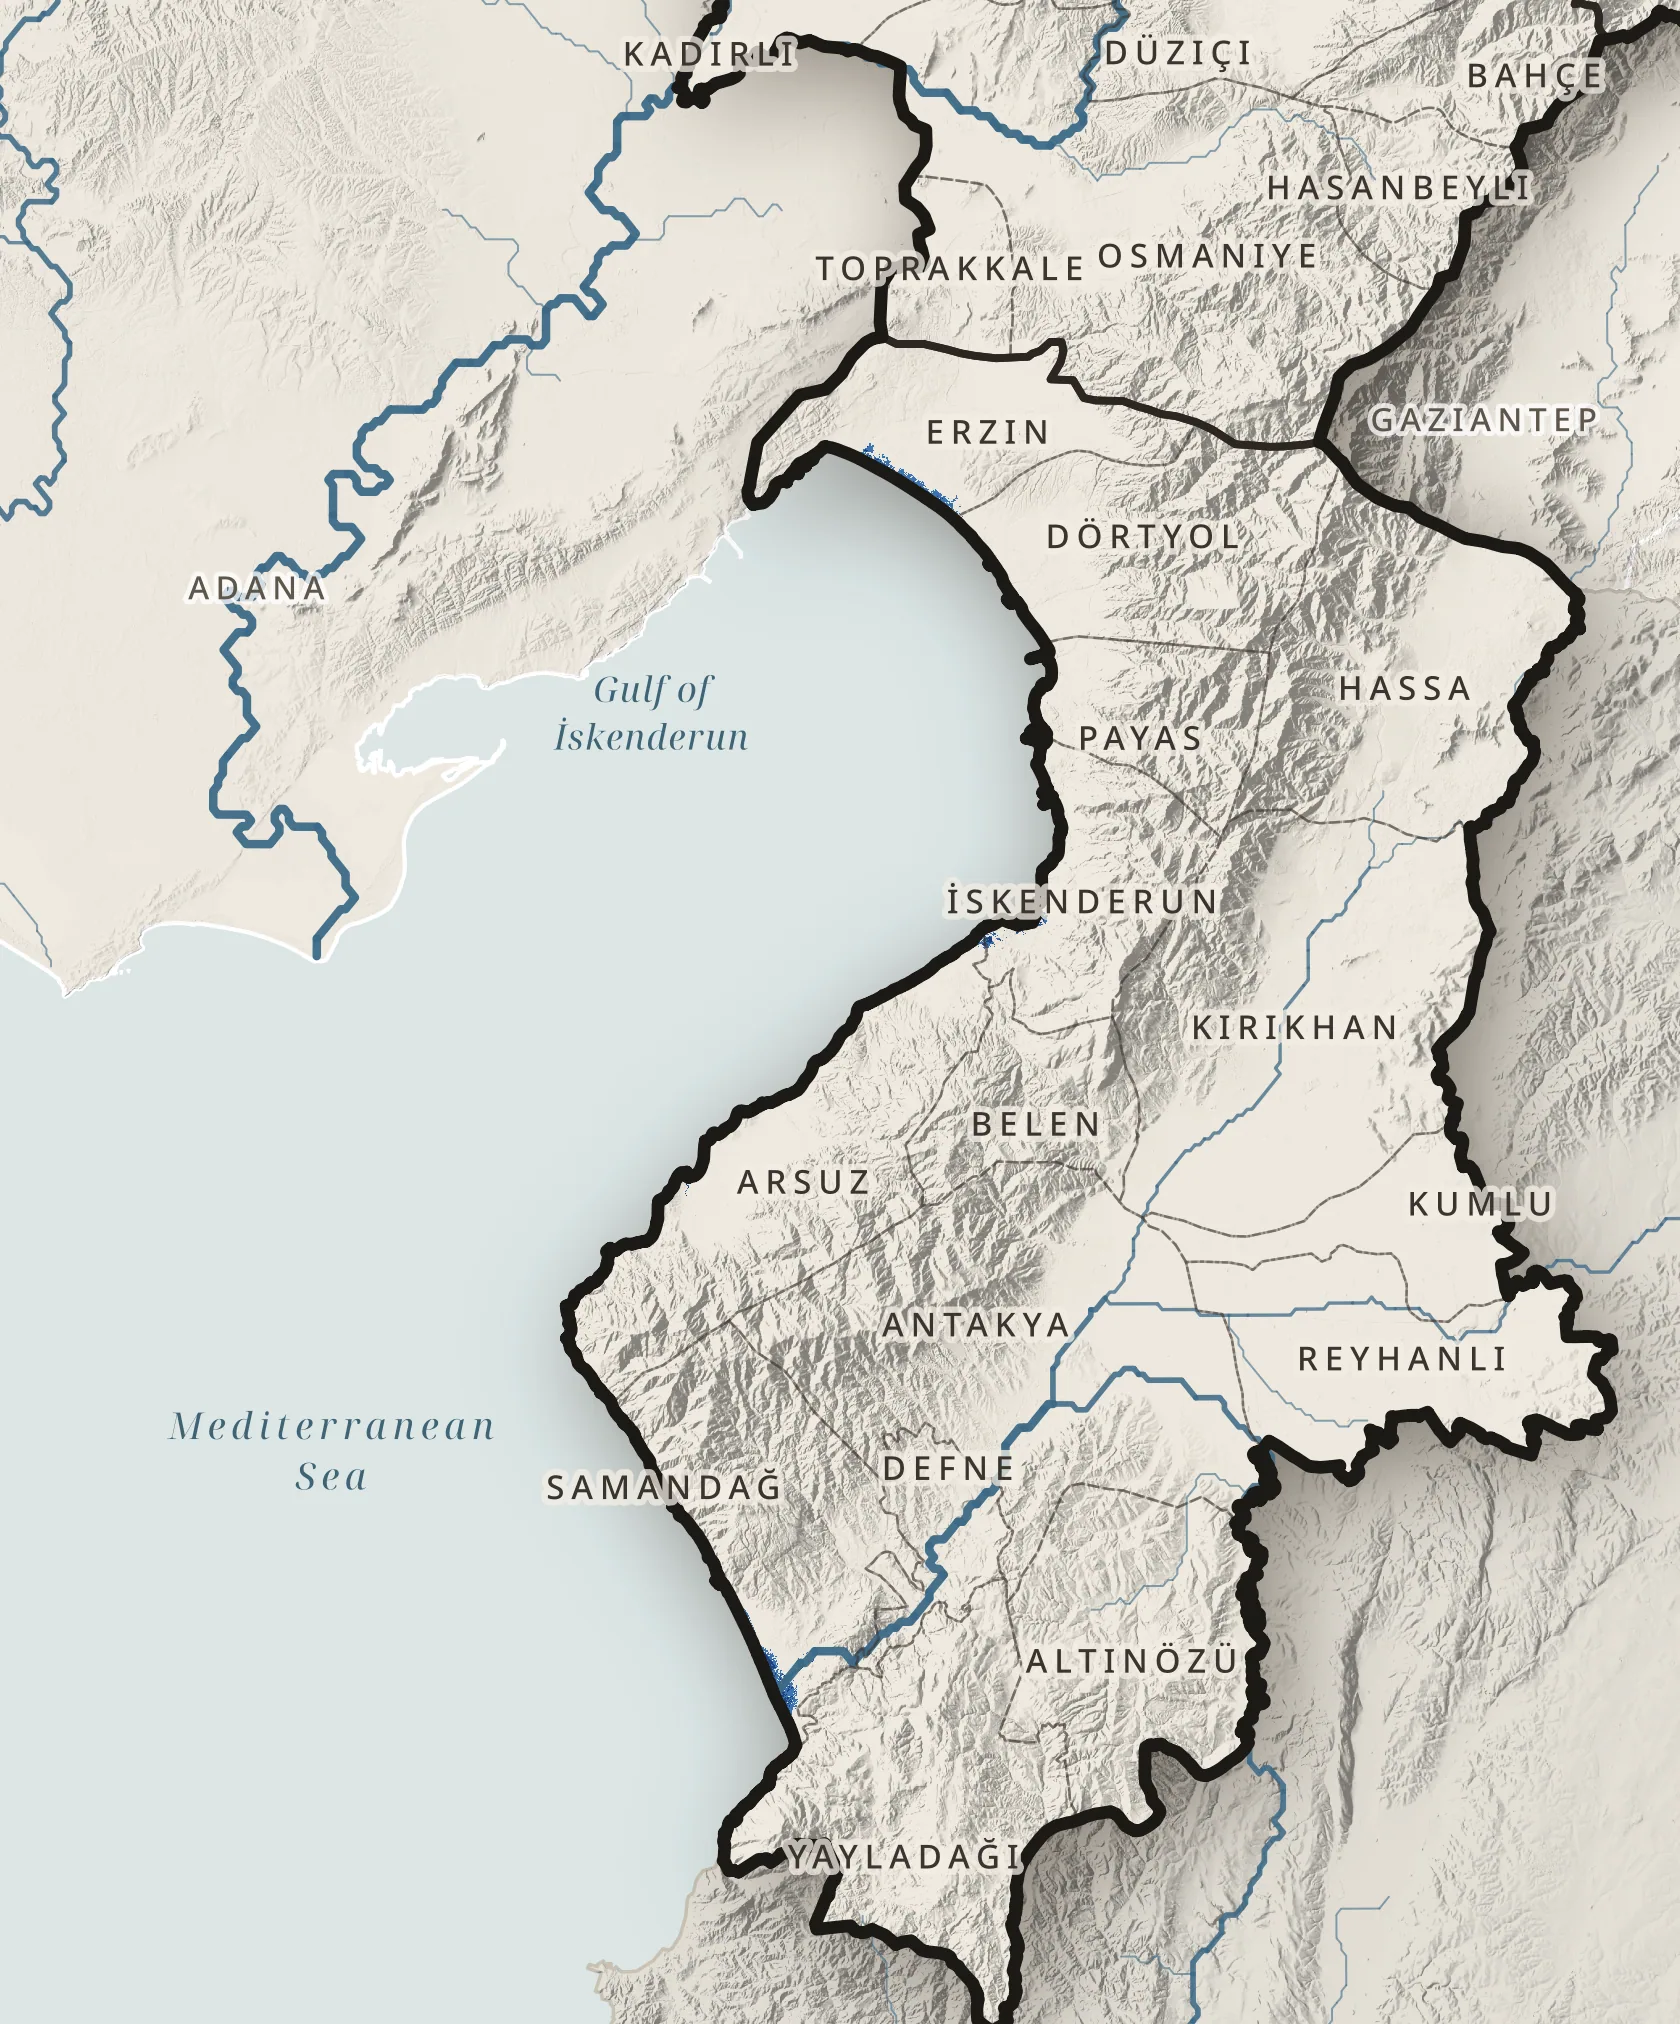
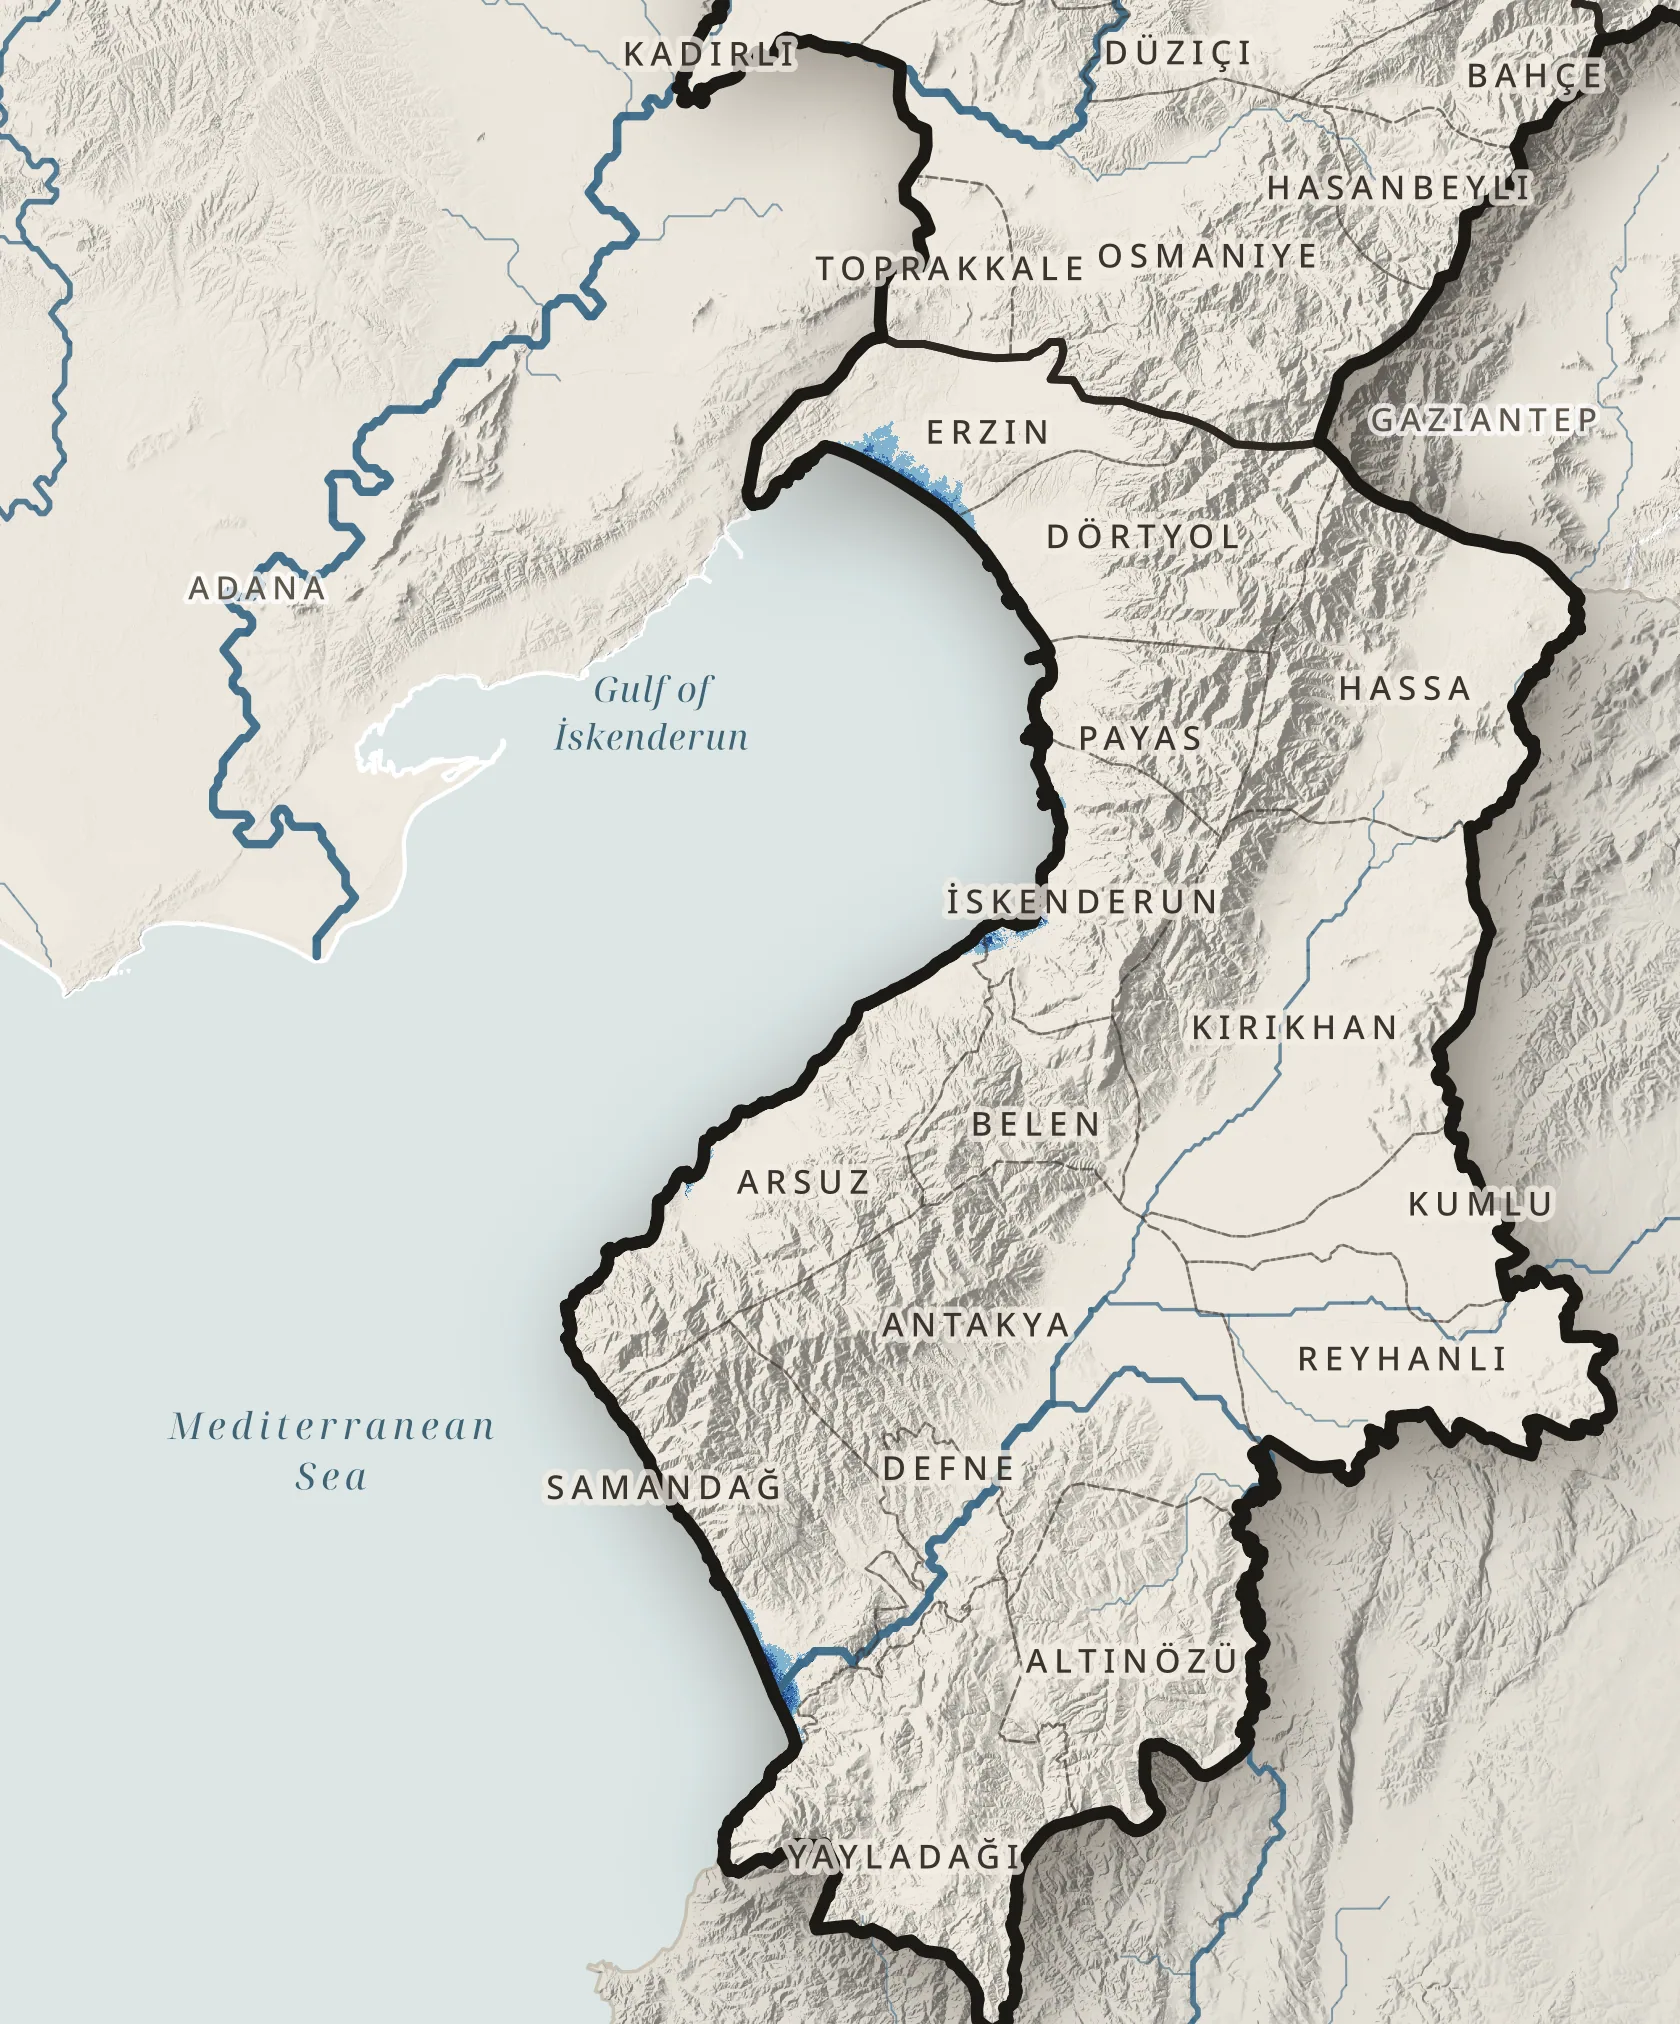
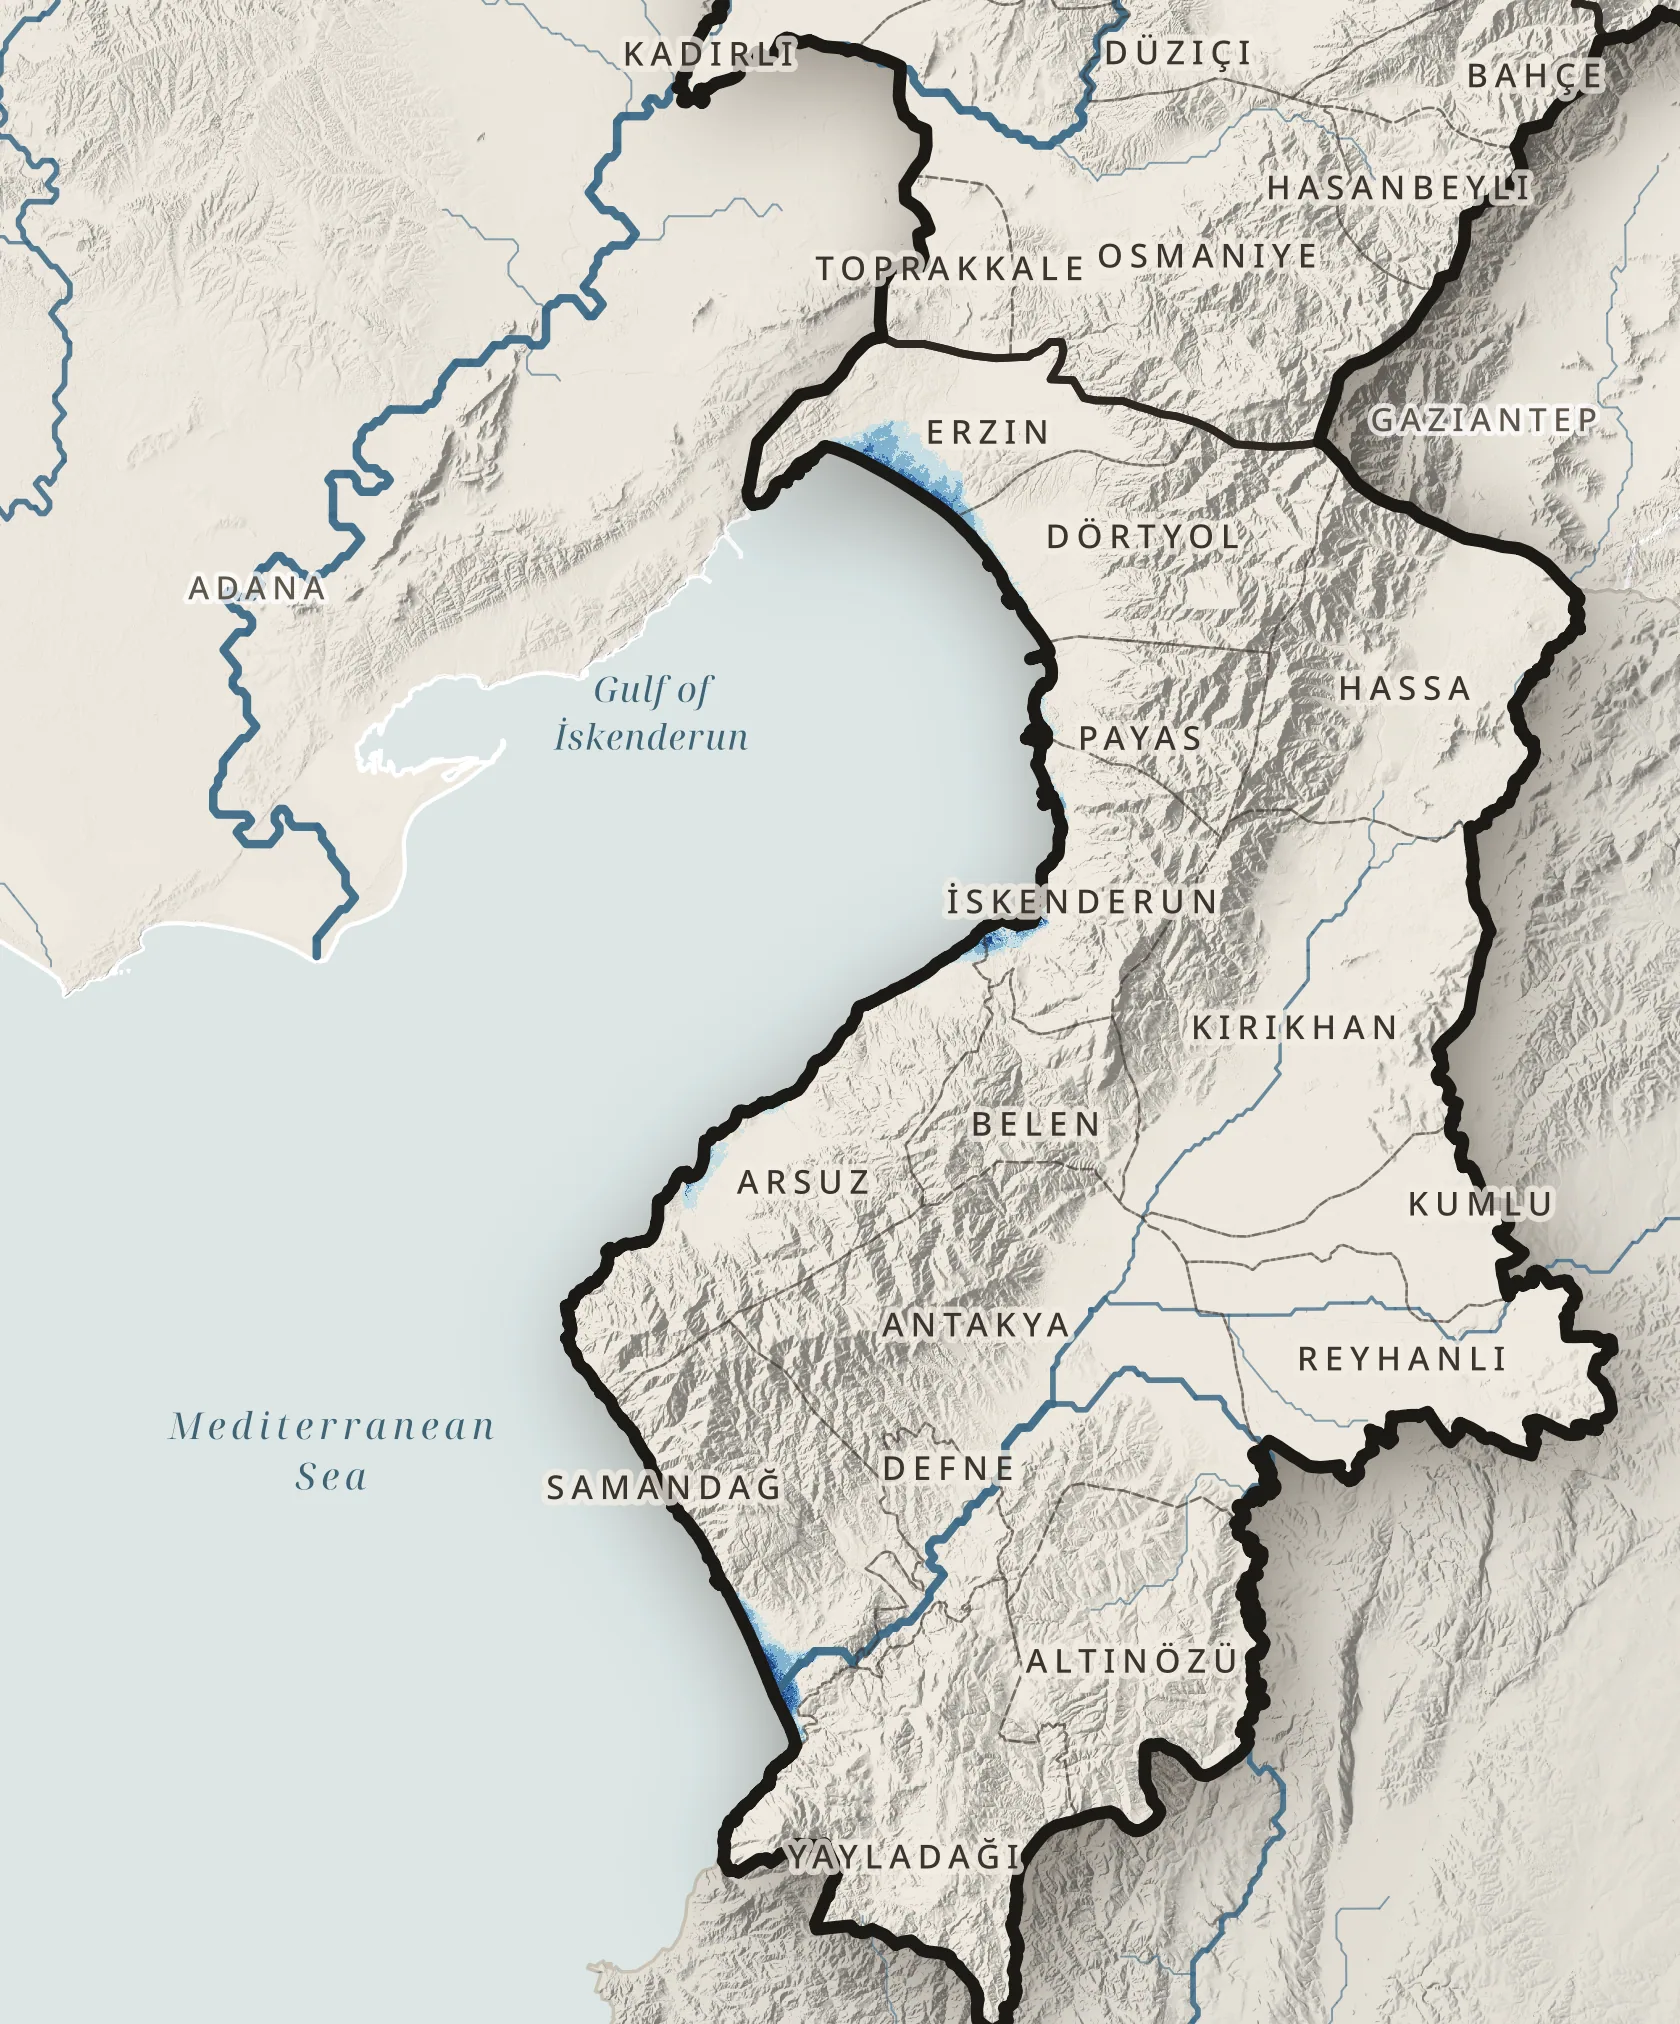
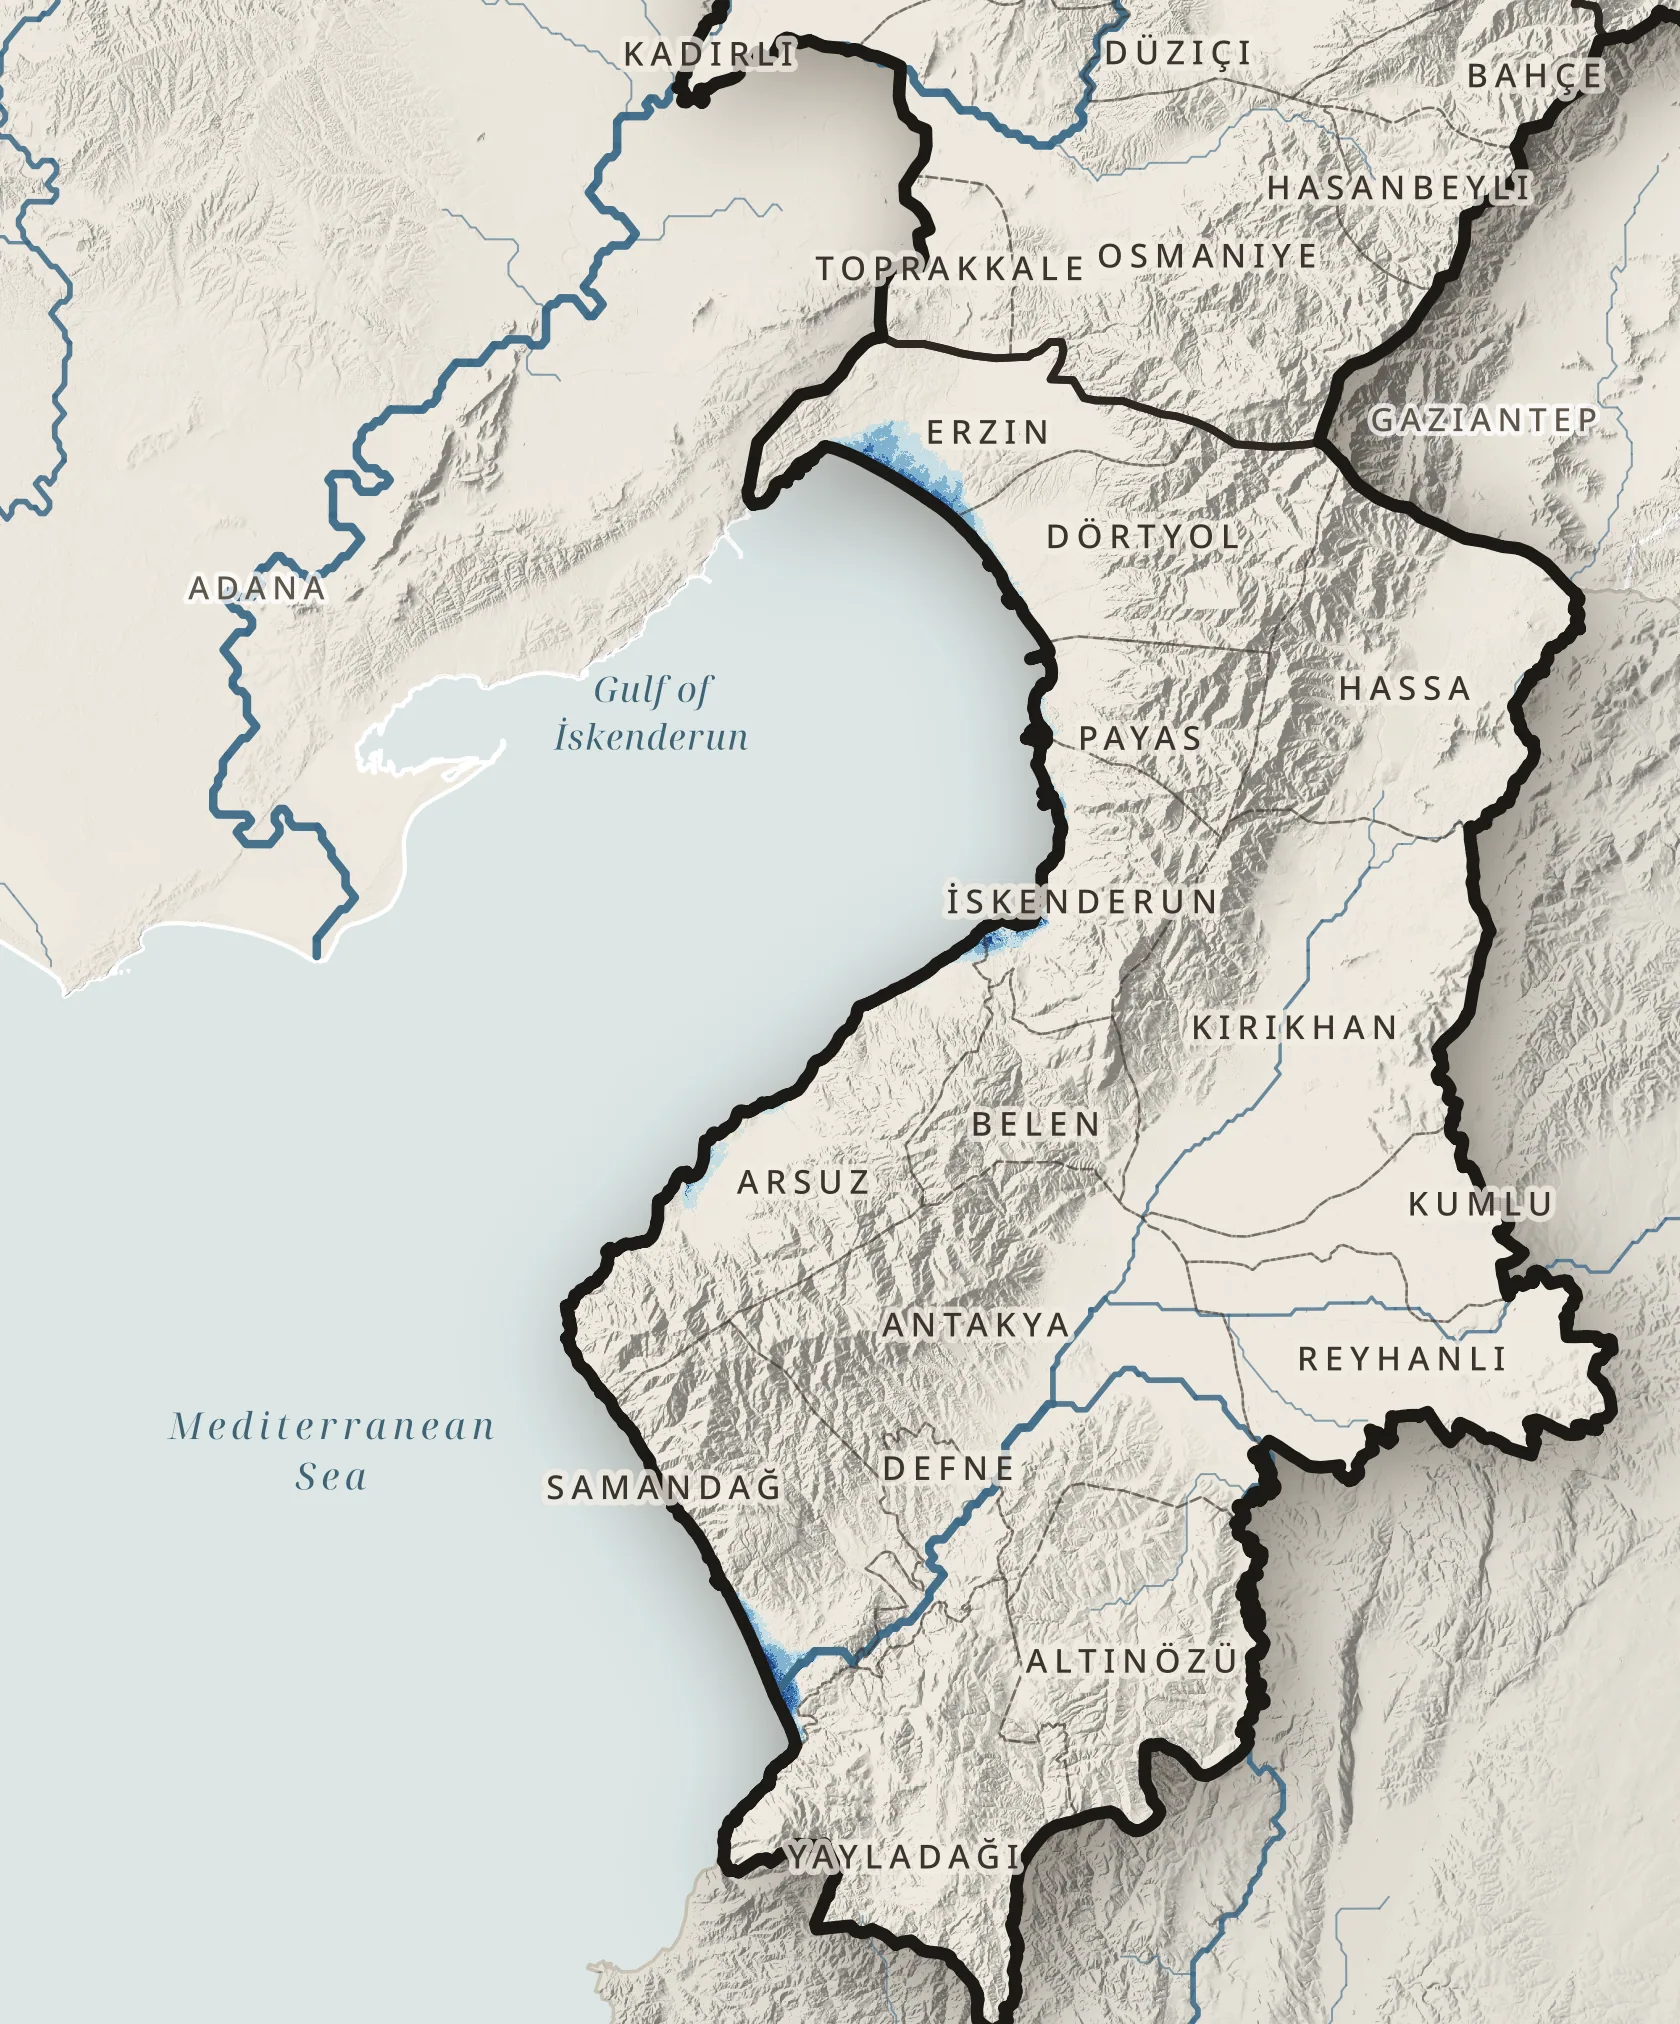
Low-lying coast · zoom
Land within reach of the sea
0km² below 1 m
0 km² of it built up
Copernicus DEM GLO-30 · GHSL built-up surface · Map R10 · ↑ ↓ raise the level